This guide is part of the Kubernetes Guide — a complete topic cluster covering Kubernetes concepts, operations, and production debugging.
Introduction
Kubernetes is not a single application. It is a distributed system made up of multiple components that communicate with each other to manage containerized workloads across a cluster of machines.
When something breaks in production — Pods are the smallest deployable unit in Kubernetes if it does not schedule, a deployment stalls, the API server becomes slow — the engineers who resolve it fastest are the ones who understand how the pieces connect. They know which component is responsible for which decision, which component to check first, and where each failure signature points.
This guide explains the complete Kubernetes architecture: the control plane that manages cluster state, the worker nodes that run workloads, how the scheduler places pods, how the network connects everything, and what a real production cluster looks like in practice.
1. What Is Kubernetes Architecture
At the highest level, a Kubernetes cluster is divided into two layers:
The Control Plane — the brain of the cluster. It makes decisions: where to run pods, how many replicas should exist, what state the cluster should be in. The control plane does not run your application workloads.
The Worker Nodes — the muscle of the cluster. They run your application containers. Each node is a machine (VM or physical server) with a container runtime, a kubelet agent, and a network proxy.
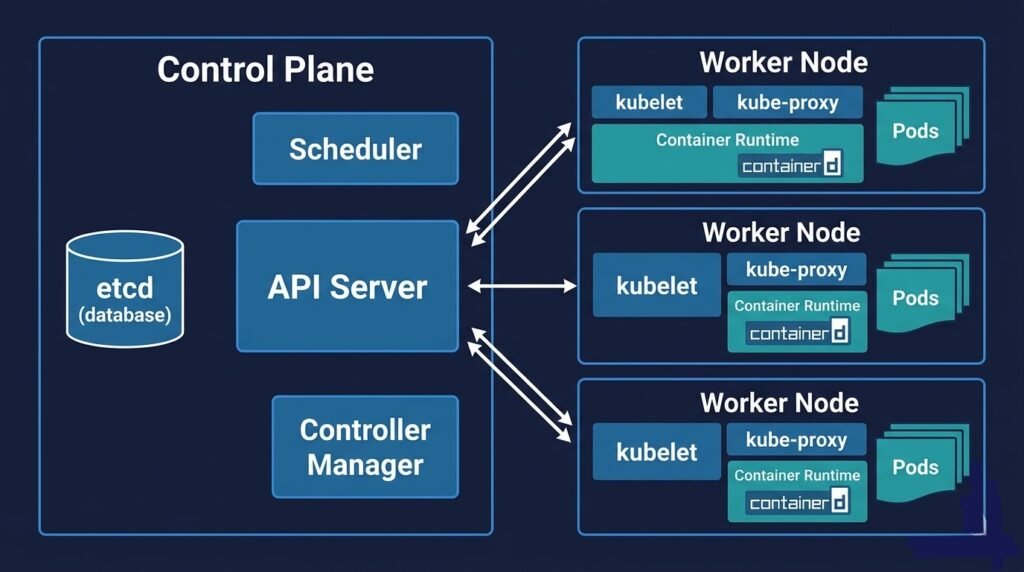
DIAGRAM: High-level Kubernetes cluster overview — left side shows Control Plane box containing API Server, etcd, Scheduler, Controller Manager, Cloud Controller. Right side shows three Worker Node boxes each containing kubelet, kube-proxy, Container Runtime, and Pods. Arrows from API Server to each kubelet.
Every interaction with the cluster — whether from kubectl, a CI/CD pipeline, or an internal component — goes through the API Server. It is the single entry point to the control plane.
2. Control Plane Components
The control plane is typically hosted on dedicated master nodes, separate from the nodes running your workloads. In managed Kubernetes services (AKS, EKS, GKE), the cloud provider runs and manages the control plane for you — it is abstracted away and you never SSH into it.
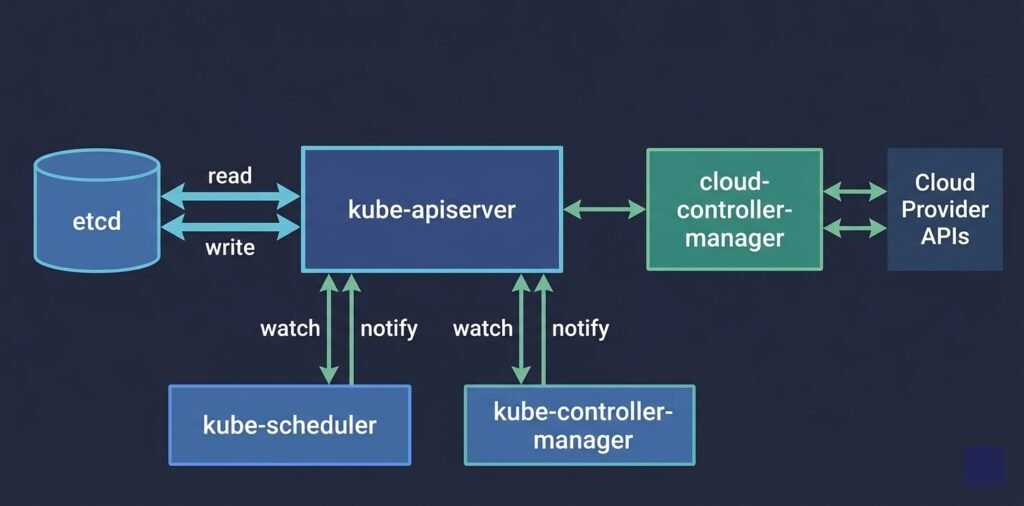
DIAGRAM: Control plane internals — API Server in the center connected to etcd on one side (read/write arrows), connected to Scheduler and Controller Manager below (watch/notify arrows), connected to Worker Nodes on the right (kubelet heartbeat arrows). Cloud Controller Manager shown separately connecting to Cloud Provider APIs.
API Server (kube-apiserver)
The API server is the front door to the entire cluster. Every operation — creating a pod, scaling a deployment, reading a configmap — is an API call to the API server.
The API server is stateless. It does not store anything itself. Every object it creates or modifies is persisted to etcd. When you run kubectl get pods, the API server reads from etcd and returns the result.
The API server also enforces authentication, authorization (RBAC), and admission control. Admission webhooks — validation and mutation — are called here before any object is persisted.
What breaks without it: Everything. No kubectl. No deployments. No scaling. Existing pods keep running (kubelet operates independently) but nothing can be managed.
etcd
etcd is a distributed key-value store that holds all cluster state. Every Kubernetes object — pods, deployments, services, configmaps, secrets, namespaces — is stored in etcd as a serialized record.
etcd is the only stateful component in the control plane. If etcd is lost without a backup, the entire cluster configuration is gone. This is why etcd backup is not optional in production — it is the cluster’s single source of truth.
etcd requires fast disk I/O (SSD with under 10ms write latency). It uses the Raft consensus protocol, which means it needs a quorum of members to elect a leader. For high availability, run etcd with 3 or 5 members — never 2 or 4 (even numbers can split-brain).
What breaks without it: The API server cannot read or write state. The cluster appears frozen — existing pods continue but no changes can be made.
Scheduler (kube-scheduler)
The scheduler watches the API server for newly created pods that have no node assigned. When it finds one, it runs a two-phase algorithm to select the best node.
Filtering removes nodes that cannot run the pod: insufficient CPU or memory, wrong labels for node selectors, taints the pod does not tolerate, unavailable persistent volumes.
Scoring ranks the remaining nodes by factors like available resources, pod affinity preferences, and zone distribution.
The scheduler then writes the selected node name to the pod object in etcd via the API server. The kubelet on that node picks up the assignment and starts the container.
What breaks without it: New pods stay in Pending indefinitely. Existing running pods are unaffected.
Controller Manager (kube-controller-manager)
The controller manager runs a collection of control loops — controllers — each responsible for reconciling one type of Kubernetes object.
The Deployment controller ensures the correct number of ReplicaSet replicas exist. The ReplicaSet controller ensures the correct number of pods exist. The Node controller monitors node heartbeats and marks nodes NotReady when they stop reporting. The Job controller creates pods for batch jobs and tracks their completion.
Each controller watches the API server for its object type, compares desired state to actual state, and takes action to reconcile the difference. This reconciliation loop is the core mechanism behind Kubernetes self-healing.
What breaks without it: Deployments do not scale. Crashed pods are not replaced. Rolling updates do not progress.
Cloud Controller Manager
In cloud environments, the cloud controller manager handles cloud-specific operations: provisioning load balancers when you create a Service of type LoadBalancer, registering new nodes as they are added to the cluster, and managing cloud provider storage.
In AKS, for example, when you create a Kubernetes Service with type: LoadBalancer, the cloud controller manager calls the Azure API to provision an Azure Load Balancer and assigns it a public IP.
3. Worker Node Components
Every worker node runs three components that are managed by the control plane but execute locally on the node. To debug worker node issues follow here.
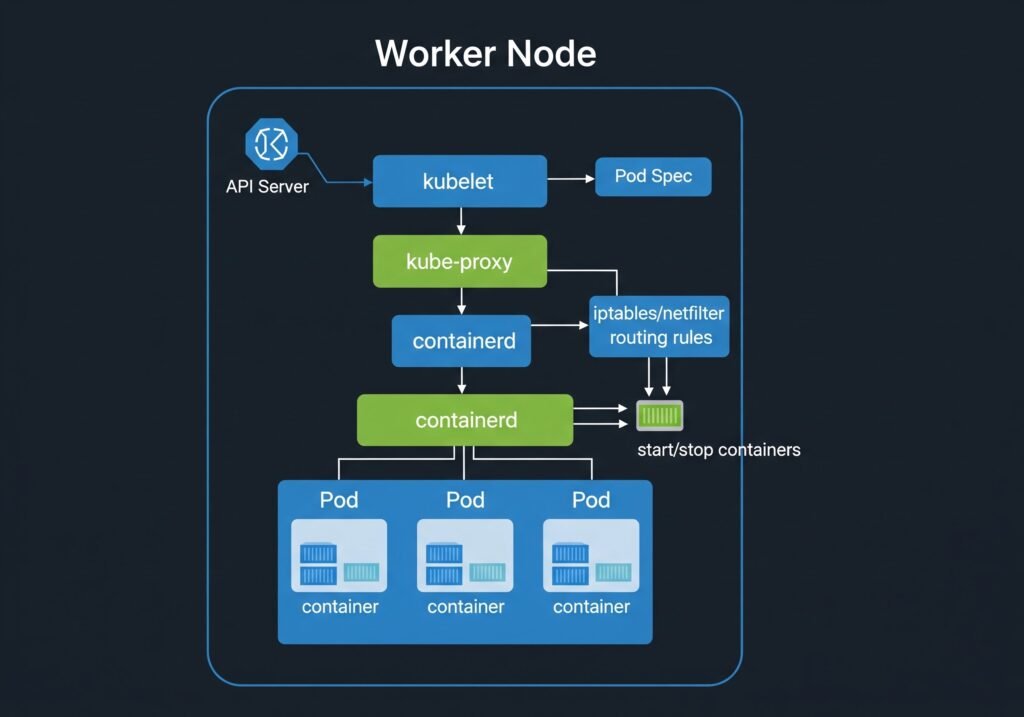
DIAGRAM: Single worker node internals — outer box labeled ‘Worker Node’. Inside: kubelet (top), kube-proxy (middle), containerd/container runtime (bottom). Below container runtime, show 3 Pod boxes, each containing containers. Arrows showing: API Server → kubelet (pod spec), kubelet → container runtime (start/stop containers), kube-proxy → iptables/kernel (routing rules).
kubelet
The kubelet is the agent that runs on every node. It registers the node with the API server and continuously watches for pod specs assigned to its node.
When a new pod is assigned to the node, the kubelet:
- Pulls the container images from the registry
- Creates the containers via the container runtime interface (CRI)
- Mounts volumes
- Runs liveness, readiness, and startup probes
- Reports pod status back to the API server
The kubelet operates independently of the control plane. If the API server goes down, existing pods continue running. The kubelet manages them locally until the API server recovers.
kube-proxy
kube-proxy runs on every node and maintains the network rules that route traffic to pods. When you create a Kubernetes Service, kube-proxy programs iptables rules (or IPVS rules in newer configurations) on every node so that traffic to the Service’s ClusterIP gets forwarded to one of the healthy pod endpoints.
kube-proxy does not proxy traffic itself at the application layer — it programs kernel-level rules. This is why Service routing in Kubernetes is extremely fast and has minimal overhead.
Container Runtime
The container runtime is the software that actually starts and stops containers. Kubernetes uses the Container Runtime Interface (CRI) to communicate with the runtime, which means it supports any CRI-compatible runtime.
containerd — the most common runtime in production clusters, including all managed Kubernetes services (AKS, EKS, GKE). Lightweight and purpose-built for Kubernetes.
CRI-O — a lightweight runtime designed specifically for Kubernetes. Common in OpenShift clusters.
Docker — historically common but Docker Engine support was removed from Kubernetes in v1.24. Clusters that used Docker now use containerd directly (which Docker itself uses under the hood).
4. How Scheduling Works
Scheduling is the process of assigning a pod to a node. Understanding the full flow helps explain both normal operation and failure modes. The scheduler assigns pods to nodes.
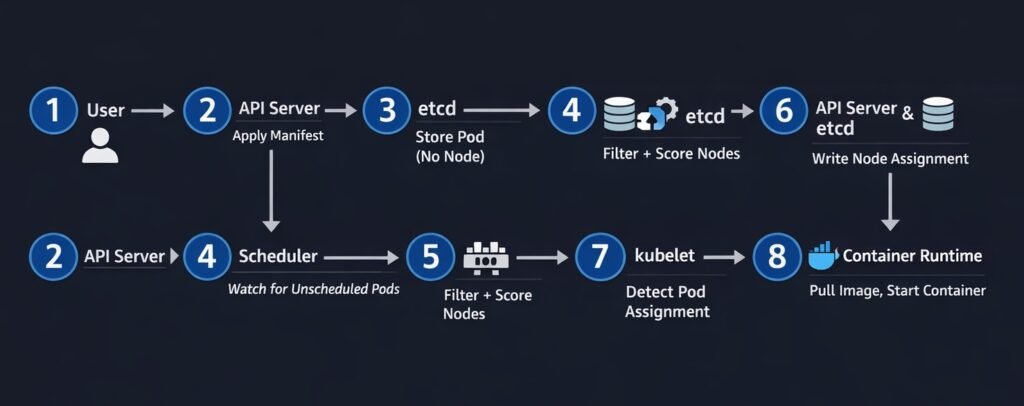
DIAGRAM: Pod scheduling flow — step by step numbered sequence: 1) User applies Deployment manifest to API Server, 2) API Server stores pod spec in etcd with nodeName empty, 3) Scheduler watches API Server and detects unscheduled pod, 4) Scheduler runs filter+score algorithm, 5) Scheduler writes selected node name to etcd via API Server, 6) kubelet on selected node detects pod assignment, 7) kubelet pulls image and starts container, 8) kubelet reports Running status back to API Server.
The scheduling flow in sequence:
- You apply a Deployment manifest —
kubectl apply -f deployment.yaml - The API server validates the manifest, persists the pod spec to etcd with
nodeName: "" - The scheduler watches the API server for pods with no node assigned
- The scheduler runs filtering (which nodes can run this pod?) and scoring (which node is best?)
- The scheduler writes the selected node name to the pod object via the API server
- The kubelet on the selected node detects the pod assignment via its watch on the API server
- The kubelet instructs the container runtime to pull the image and start the container
- The kubelet reports the pod’s Running status back to the API server
The entire sequence from kubectl apply to pod Running typically takes 5–15 seconds in a healthy cluster with pre-pulled images.
5. Cluster Networking Overview
Kubernetes networking follows three fundamental rules:
- Every pod gets its own IP address
- All pods can communicate with all other pods without NAT
- All nodes can communicate with all pods without NAT
These rules are implemented by the Container Network Interface (CNI) plugin — a piece of software that runs on every node and handles IP address assignment and routing. Kubernetes networking is a major pillar of architecture
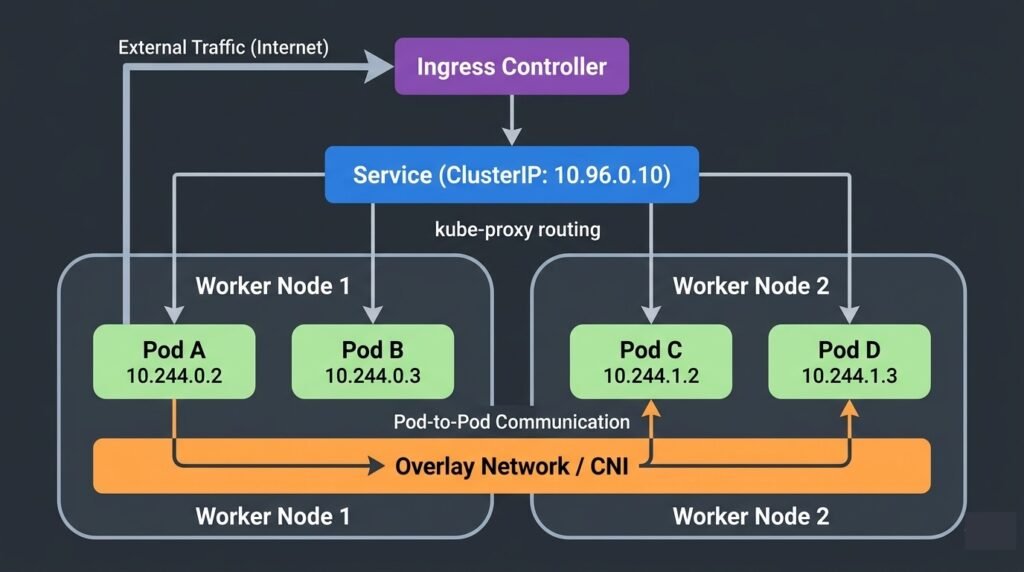
DIAGRAM: Kubernetes cluster networking overview — show two worker nodes. On each node show two pods with their own IPs (e.g. 10.244.0.x and 10.244.1.x). Show pod-to-pod communication across nodes via an overlay network or direct routing. Show a Service ClusterIP pointing to pod endpoints via kube-proxy. Show an Ingress at the top routing external traffic to the Service.
CNI plugins handle the networking implementation. Common options:
- Calico — most popular in production, supports NetworkPolicy enforcement
- Cilium — eBPF-based, high performance, advanced observability
- Flannel — simple overlay network, common in development clusters
- Azure CNI — native in AKS, assigns Azure VNet IPs directly to pods
Services provide stable DNS names and ClusterIPs that abstract away the ephemeral pod IPs underneath. When pods are replaced, the Service stays the same — kube-proxy updates the routing rules automatically.
Ingress controllers route external HTTP/HTTPS traffic into the cluster, handling hostname-based and path-based routing to backend Services.
6. Real Production Architecture
A production Kubernetes cluster in a cloud environment looks significantly different from a minimal development setup.
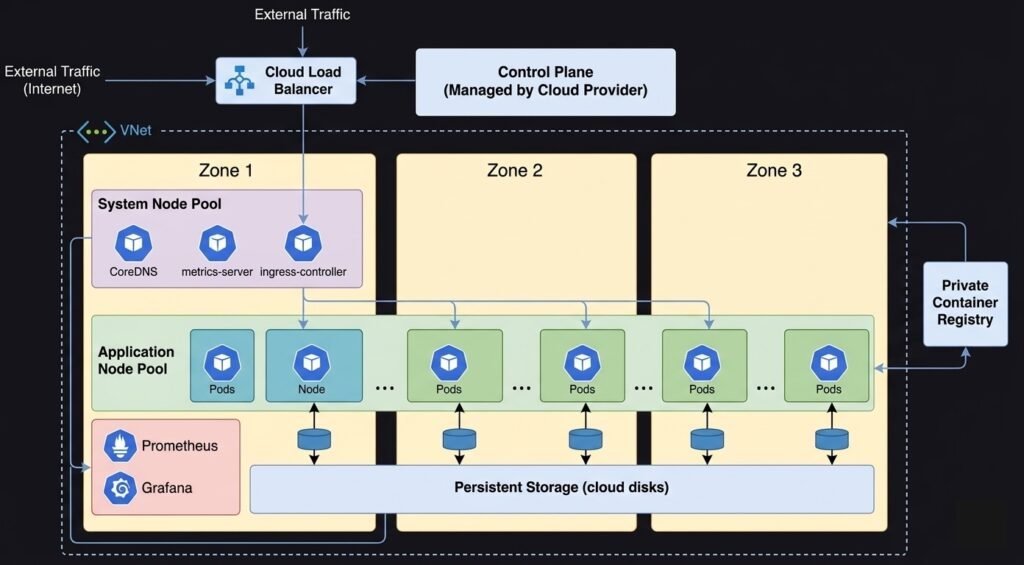
DIAGRAM: Production AKS/EKS/GKE reference architecture — show multiple availability zones. Control plane in a managed zone (cloud provider managed). System node pool in zone 1 with system pods (CoreDNS, metrics-server, ingress controller). Application node pool spread across zone 1, 2, 3 with application pods. Azure Load Balancer or cloud LB in front. Private container registry. Persistent storage (Azure Disk/EBS/PD). Monitoring stack (Prometheus/Grafana). VNet/VPC boundary around the whole cluster.
Key differences in production:
High availability control plane — 3 API server replicas, 3 or 5 etcd members, multiple scheduler and controller manager instances with leader election. In managed clusters, the cloud provider handles this.
Multiple node pools — a system node pool for cluster infrastructure (CoreDNS, metrics-server, ingress controllers) and one or more application node pools for workloads. System nodes are cordoned from application workloads using taints.
Node pool autoscaling — cloud-native autoscalers provision or decommission nodes based on pod scheduling demand. When all nodes are full, a new node is provisioned automatically (typically within 2–5 minutes).
Multi-zone distribution — nodes and pods spread across availability zones to survive a zone outage. Pod topology spread constraints and pod anti-affinity enforce distribution.
Private networking — nodes have private IPs only. The API server endpoint may be private or have IP allowlisting. Container registry is private. No public node IPs.
7. When Things Go Wrong
kubectl commands hang or time out — the API server is degraded. Check admission webhooks first (a failing webhook with no timeout blocks all requests). In managed clusters, check the cloud provider’s control plane health page. See: Debugging Kubernetes Control Plane Failures
New pods stay Pending indefinitely — the scheduler is not placing them. Check pod events with kubectl describe pod. Causes include insufficient node resources, taint mismatches, and affinity rules. See: Debugging Kubernetes Scheduling Problems
Pods are not replaced after crashing — the controller manager may be degraded. Test by creating a simple deployment and checking if a ReplicaSet is created. See: Debugging Kubernetes Control Plane Failures
Nodes enter NotReady — kubelet has stopped reporting heartbeats. Check kubelet status, container runtime health, memory and disk pressure. See: How to Fix Kubernetes Node NotReady
Service traffic not routing — kube-proxy may not have updated iptables rules. Check Service endpoints and kube-proxy pod health. See: Production Kubernetes Debugging Handbook
Summary
Kubernetes architecture is built around a clean separation between the control plane (decisions) and worker nodes (execution):
- API Server — single entry point for all cluster operations
- etcd — stores all cluster state, must be backed up
- Scheduler — assigns pods to nodes using filter and score phases
- Controller Manager — reconciles desired vs actual state continuously
- kubelet — executes pod specs on each node, operates independently
- kube-proxy — maintains network routing rules for Services
- Container Runtime — starts and stops containers (containerd in modern clusters)
Understanding which component owns which decision is the fastest path to diagnosing production failures.
Continue learning:
- Kubernetes Pods Explained
- Kubernetes Networking Explained
- Kubernetes Scheduler Explained
- Debugging Kubernetes Control Plane Failures
- Production Kubernetes Debugging Handbook
- Back to Kubernetes Guide
When Things Go Wrong
Understanding Kubernetes architecture is critical when debugging production failures.
If the control plane becomes unavailable, scheduling stops.
If kubelet communication fails, nodes may become NotReady.
If etcd loses quorum, the entire cluster state can become unavailable.
For a detailed operational guide, see:
→ Production Kubernetes Debugging Handbook