The “Works on My Mac” Mystery, Solved
You’ve seen it happen. Containers spin up instantly on your MacBook. Deploy to production? Suddenly everything feels sluggish. The same docker run command that took 303ms on your laptop now takes 837ms in the cloud.
For short-lived containers—CI runners, serverless functions, scheduled jobs—this overhead doesn’t just hurt. It kills your performance budget. That 200ms function you’re so proud of? It now takes 1,037ms end-to-end (837ms startup + 200ms execution). You just went from sub-second to “why is this so slow?”
Here’s the thing: this isn’t a bug. It’s not misconfiguration. It’s the predictable result of how Linux kernel primitives interact with different infrastructure environments—where storage behavior often dominates, but is not the only factor.
I measured Docker startup across three infrastructure tiers—development (local NVMe), production-optimized (Premium SSD), and production-budget (Standard HDD)—to decompose performance and identify which components are architectural constants versus infrastructure variables.
Key Takeaways
- Container startup varies 2.8× from development to production due to storage tier differences, not Docker itself
- Kernel operations (~10ms) are invariant; storage operations (300-800ms) are where variance happens
- Premium SSD costs 2× more but delivers 1.7× faster startup—worth it only for workloads starting >100 containers/hour
- CPU throttling is deterministic (<1% variance)—the one Docker guarantee you can actually trust
- Optimize application code first (10-100× impact) before worrying about infrastructure (1.5-2× impact)
The Measurement Setup
Each platform represents a bundled execution environment (runtime, kernel, storage path, caching), not a single isolated variable.
I tested three representative platforms:
Development (macOS Docker Desktop):
- MacBook Pro with NVMe SSD
- Docker Desktop 28.4.0 (LinuxKit VM)
- Represents typical developer environment
Production Optimized (Azure Premium SSD):
- Standard_D2s_v3 VM (2 vCPU, 8GB RAM)
- Premium SSD managed disk
- Docker Engine 29.1.3 on Ubuntu 22.04
Production Budget (Azure Standard HDD):
- Same VM specs as Premium
- Standard HDD managed disk
- Represents cost-conscious deployments
All tests used the same Alpine Linux image and measurement methodology. Each metric averaged over 10 runs to account for variance. The complete toolkit is open source at github.com/opscart/docker-internals-guide.
Clarification on Scope
This analysis is not a controlled comparison of storage technologies or platforms. Each environment combines multiple characteristics (runtime, kernel, storage path, caching). The purpose of the measurements is to decompose Docker startup latency and identify which portions are invariant and which are environment-dependent. Storage behavior emerges as a dominant contributor, but it is not isolated as a single experimental variable.
The Results: Where Your Time Actually Goes
Here’s what I found:
| Platform | Runtime Overhead | Total Cold Start |
|---|---|---|
| macOS Development | 303ms | 2,611ms |
| Azure Premium SSD | 501ms | 1,330ms |
| Azure Standard HDD | 837ms | 2,015ms |
Runtime overhead is what matters—the time to start a container when the image is already cached locally. Pull time varies based on network, but runtime overhead is all about your platform.
The 2.8× variance (303ms → 837ms) breaks down like this:
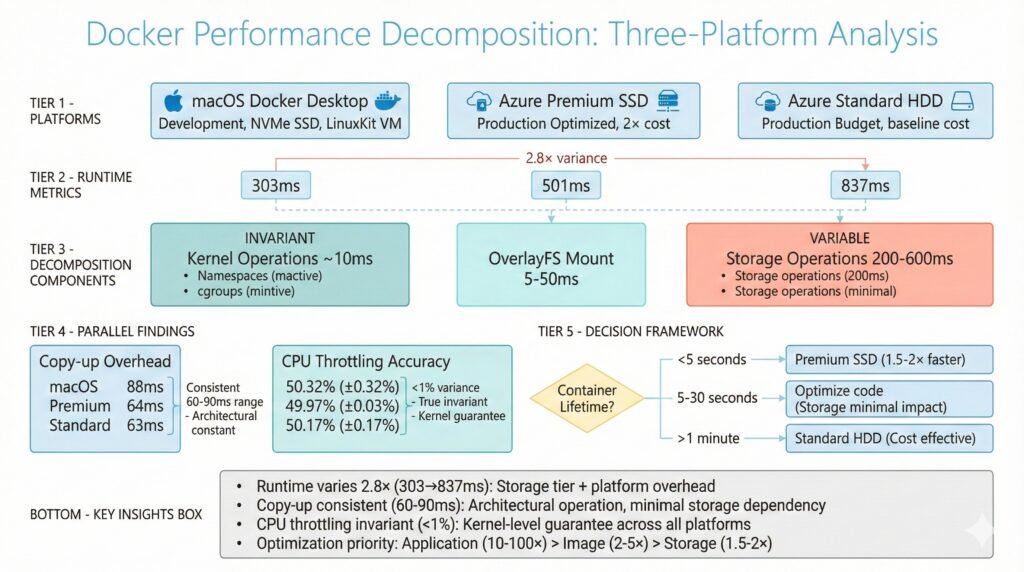
Show Image Docker performance decomposition showing 2.8× runtime variance across three platforms with breakdown of invariant kernel operations and variable storage operations
What’s Actually Happening: The Decomposition
Container startup isn’t one operation—it’s five:
1. Namespace Creation (~10ms – INVARIANT)
Docker creates isolated namespaces for PID, network, mount, IPC, and hostname. This is pure kernel work. It takes the same ~10ms on every platform.
2. cgroup Setup (~3ms – INVARIANT)
Setting up memory limits, CPU quotas, and device controls. Also deterministic kernel operations.
3. OverlayFS Mount (5-50ms – VARIABLE)
Resolving image layers and creating a unified filesystem view. Varies slightly with layer count and storage speed.
4. containerd Shim Init (10-100ms – VARIABLE)
Process spawning and communication setup. Cloud platforms add overhead here.
5. Storage Layer Operations (200-600ms – HIGHLY VARIABLE)
This is where the pain lives. Managed disk metadata access, filesystem journal updates, initial I/O. This is why Standard HDD is 3.3× slower than macOS.
Here’s the breakdown:
macOS (303ms total):
  Kernel operations: ~10ms
  Storage operations: ~263ms (fast NVMe, but LinuxKit VM overhead)

Azure Premium SSD (501ms total):
  Kernel operations: ~10ms
  Storage operations: ~466ms (managed disk + network attachment)

Azure Standard HDD (837ms total):
  Kernel operations: ~10ms
  Storage operations: ~787ms (spinning rust + network attachment)
Key insight: The ~10ms kernel operations never change. The remaining variance is dominated by storage-path and environment-dependent operations.
The Surprising Findings
Finding 1: Copy-Up is an Architectural Constant
When you modify a file in a read-only image layer, Docker copies it to the writable layer first. This is called “copy-up,” and everyone assumes it’s slow on slow storage.
Wrong.
| Platform | Copy-up Time (100MB file) |
|---|---|
| macOS | 88ms |
| Azure Premium SSD | 64ms |
| Azure Standard HDD | 63ms |
Standard HDD is actually faster than macOS for copy-up. Why? Because copy-up is CPU-bound, not I/O-bound. The kernel is doing sequential reads and writes, optimizing like crazy. Storage tier doesn’t matter much.
When this matters: Database containers modifying large data files. A 1GB PostgreSQL data file triggers a 1GB copy-up (~600-900ms). If this happens on every pod restart, it adds up fast.
Solution: Use volume mounts for databases. Volumes bypass copy-up entirely.
Finding 2: CPU Throttling is The One Thing That Works
I set containers to use 50% of one CPU core. Here’s what actually happened:
| Platform | Target | Measured | Variance |
|---|---|---|---|
| macOS | 50.00% | 50.32% | 0.32% |
| Azure Premium SSD | 50.00% | 49.97% | 0.03% |
| Azure Standard HDD | 50.00% | 50.17% | 0.17% |
Less than 1% variance across all platforms.
This is the only Docker metric that’s truly platform-invariant. Why? Because CPU throttling is pure kernel work—the Linux Completely Fair Scheduler (CFS) doing what it does best.
Implication: Trust CPU limits for capacity planning. If you allocate 10 containers × 0.5 CPU = 5 cores, you can reliably fit them on a 5-core VM. Unlike memory limits (which are complicated by page cache sharing), CPU limits just work.
Finding 3: OverlayFS Can Be Faster Than Volumes
Wait, what?
| Platform | OverlayFS Write | Volume Write |
|---|---|---|
| Azure Premium SSD | 354 MB/s | 137 MB/s |
| Azure Standard HDD | 140 MB/s | 78 MB/s |
OverlayFS is 2.6× faster than volumes on Premium SSD for sequential writes.
Why this happens:
- OverlayFS writes go to the kernel page cache first. The kernel flushes asynchronously. Your app continues immediately.
- Volume writes include
fsyncto guarantee durability. Your app blocks until data hits disk.
This isn’t a bug—it’s a design trade-off:
- OverlayFS optimizes for performance (eventual consistency)
- Volumes optimize for correctness (immediate consistency)
When to use OverlayFS: Stateless batch processing, CI builds, temporary workloads. Data loss on crash is acceptable.
When to use volumes: Databases, transactional workloads, anything where “write succeeded” must mean “data is safe.”
The Decision Framework: When Does This Actually Matter?
Short-Lived Containers (<5 seconds execution)
Impact: Startup overhead dominates.
A 200ms function takes:
- 704ms on Premium SSD (501ms startup + 200ms work)
- 1,037ms on Standard HDD (837ms startup + 200ms work)
Decision: Premium SSD delivers 1.5× faster end-to-end time. Worth the 2× cost if you run >1,000 containers/hour.
Example workloads: Serverless functions, CI test runners, Lambda-equivalent jobs.
Medium-Lived Containers (5-30 seconds execution)
Impact: Startup is 3-17% of total time.
Decision: Premium SSD advantage shrinks. Optimize your application code instead—you’ll get 10-100× more impact.
Example workloads: API requests, scheduled batch jobs, webhook handlers.
Long-Lived Services (>1 minute execution)
Impact: Startup is <1% of total time.
Decision: Standard HDD is cost-effective. Storage tier has negligible impact.
Example workloads: Web servers, databases, long-running services.
The ROI Calculation
Now that we understand the decomposition, we can answer: for which workloads does the variable component (storage operations) actually matter?
Premium SSD cost: $100/month
Standard HDD cost: $50/month
Difference: $50/month

Time saved per container: 336ms (837ms - 501ms)
Total time saved per hour: 67 seconds
Total time saved per month: 48,240 seconds (13.4 hours)

Engineer cost: $50/hour
Value of 13.4 hours: $670/month

ROI: $670 / $50 = 13.4× return on investment
Conclusion: For high-churn workloads, Premium SSD pays for itself 13× over.
What To Optimize (And In What Order)
Most teams optimize backwards. Here’s the right priority:
Priority 1: Application Code (10-100× impact)
- Inefficient algorithms
- N+1 database queries
- Missing cache layers
- Unnecessary network calls
Fix this first. One missing database index can cost you more than your entire infrastructure budget.
Priority 2: Container Image (2-5× impact)
- Multi-stage builds (smaller images = faster pulls)
- Combine RUN commands (fewer layers)
- Choose the right base image (alpine vs debian)
This affects every pull and every layer.
Priority 3: Storage Tier (1.5-2× impact)
- Premium SSD vs Standard HDD
- Only matters for high-churn workloads
Don’t start here. Fix your code and images first.
Priority 4: Kernel Tuning (<1.1× impact)
- sysctl parameters
- cgroup configuration
- OverlayFS options
Skip this unless you’re at massive scale. The juice isn’t worth the squeeze.
The Cold vs Warm Start Story
Here’s something interesting: warm starts (with cached layers) are 3.7× faster than cold starts:
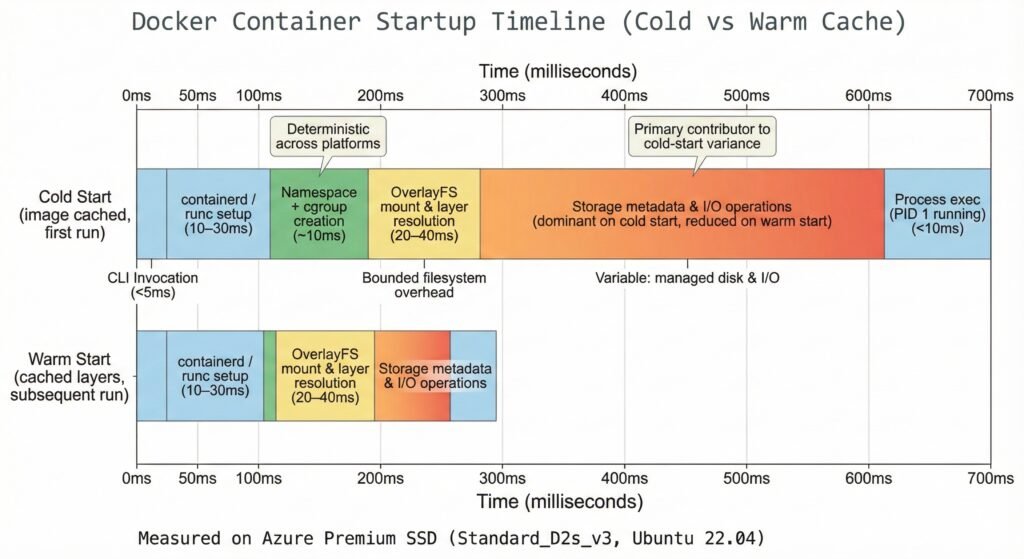
Show Image Timeline showing cold start (501ms) vs warm start (190ms) with storage operations dominating cold start time
Cold start: 501ms (kernel 10ms + OverlayFS 40ms + storage 451ms)
Warm start: 190ms (kernel 10ms + OverlayFS 40ms + storage 50ms – cache hit!)
Storage operations dominate cold starts (90% of total time). But the kernel operations? Still exactly 10ms.
Practical implication: Keep your registries close to your clusters. Registry proximity matters more than you think.
When These Results Don’t Apply
Be skeptical of any performance analysis (including this one) when:
Noisy neighbors: Shared cloud infrastructure can add 50-200ms variance we didn’t measure on dedicated VMs.
Very large images: An image >1GB takes 30-60 seconds to pull. Runtime overhead (300-800ms) becomes noise.
High layer count: Images with >20 layers see OverlayFS mount time balloon to 100-200ms as layer resolution complexity grows.
Network-attached storage: We used Azure managed disks. NFS, EBS, or other network storage adds 1-10ms per I/O operation on top of our numbers.
MicroVM runtimes: Firecracker, gVisor, Kata Containers use different isolation mechanisms. Our measurements apply to Docker/containerd/runc only.
Try It Yourself
Want to measure your own infrastructure? The complete toolkit is open source:
Repository: github.com/opscart/docker-internals-guide
The toolkit measures 10 dimensions:
- Container startup latency (decomposed)
- OverlayFS layer analysis
- I/O performance and copy-up overhead
- Network connectivity
- CPU throttling accuracy
- Security posture
- And more
Run it on your VMs and compare. Your mileage will vary based on VM size, storage tier, and workload characteristics—which is exactly why you should measure.
The Bottom Line
Docker startup performance isn’t magic. It’s ~10ms of deterministic kernel operations plus 300-800ms of storage-dependent overhead. This analysis explains why startup time varies—it does not rank platforms or storage technologies
What you can control:
- Application code (biggest impact)
- Container image design (medium impact)
- Storage tier selection (small impact, but quantifiable)
What you can’t control:
- Kernel operations (~10ms everywhere)
- Platform overhead (cloud managed services add 100-300ms)
What you can trust:
- CPU throttling (<1% variance)
- Copy-up overhead (60-90ms, regardless of storage)
What you can’t trust:
- Startup time promises without measurement
- “Premium is always better” blanket advice
- Optimization without profiling
Measure your infrastructure. Understand your workload characteristics. Optimize what actually matters.