
Summary
When Kubernetes replaces an LLM pod, the pod can come back long before the model is actually ready to answer a request.
That sounds obvious once you say it out loud, but most readiness checks do not measure the full inference path. They usually tell us that the process is alive or that an HTTP endpoint is responding.
I wanted to measure the gap between those states.
This note documents a set of controlled Ollama recovery experiments on Kubernetes, first on a local Minikube environment and then on an Azure CPU VM. The focus is recovery behavior, not model quality or throughput.
The experiments separate:
- Kubernetes readiness
- inference-runtime availability
- model artifact availability
- model residency
- first successful inference
The full experiment repository is here:
https://github.com/opscart/k8s-llm-recovery-lab
The repository contains the manifests, recovery scripts, raw CSV results, environment captures, and analysis code. I keep the raw measurements separate from the derived analysis so the individual runs can be inspected without relying on the conclusions in this note.
Why I Started Measuring This
The original question was simple:
When Kubernetes replaces a self-hosted LLM pod, at what point is the application actually recovered?
For many stateless services, container startup, readiness, and functional availability happen close enough together that teams often treat them as one event.
LLM serving has more state in the path.
The runtime has to start. The model artifact has to be available. The model may need to be loaded into memory. Then the first inference still has to complete.
Those stages can happen at very different times, so I stopped using “pod recovery” as a single measurement.
Recovery Timeline
I measured five timestamps:
T0 - pod replacement requested
T1 - Kubernetes reports Ready
T2 - inference runtime responds to HTTP
T3 - first post-recovery inference request begins
T4 - inference request completes successfully
From those timestamps:
Kubernetes recovery    = T1 - T0
Runtime recovery       = T2 - T0
Functional recovery    = T4 - T0
Ready -> inference gap = T4 - T1
The last metric is the one I care about most operationally.
It tells me how long Kubernetes has considered the pod ready before the workload actually completes an inference request.
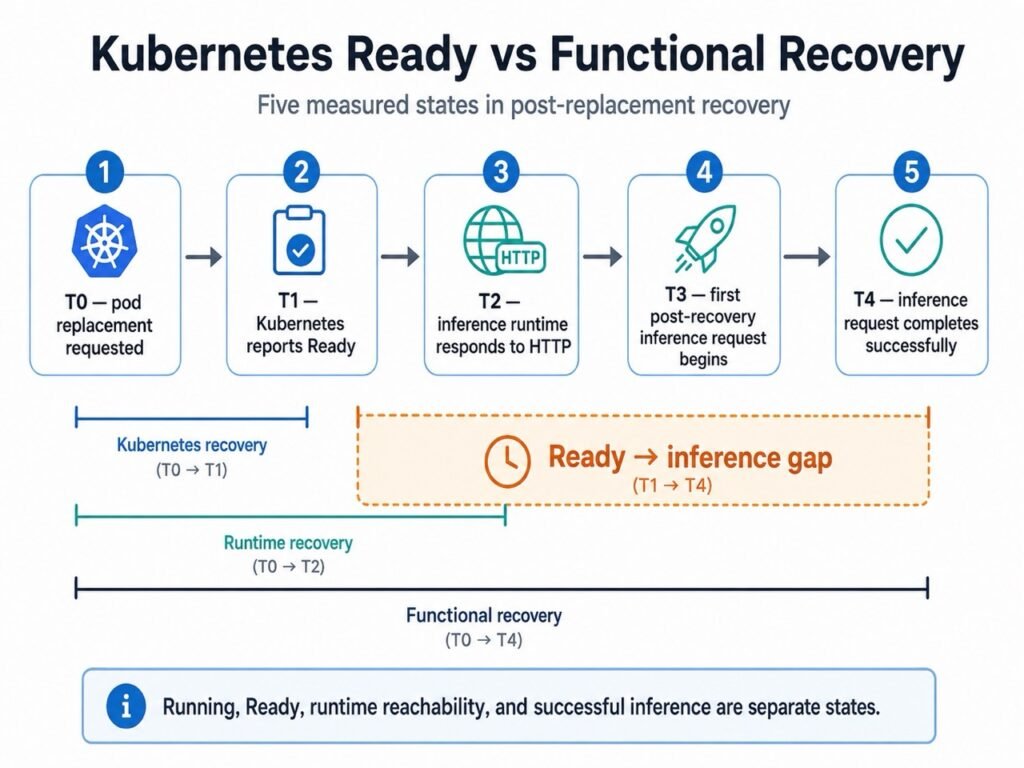
Figure 1: Kubernetes Ready vs Functional Recovery
Experiment Scope
The current experiment set includes:
- local Minikube on Mac, CPU-only
- Azure
Standard_D16s_v5Linux VM, CPU-only - Ollama as the serving runtime
llama3.2:1bllama3.2:3b- a larger
llama3.1:8bvalidation - same-node pod replacement
- inference-aware readiness tests
- warm vs. cold Linux filesystem/page-cache conditions
For the 1B and 3B comparison, both models used the same 2 CPU / 4 GiB container envelope.
The 8B run used a larger 8 CPU / 16 GiB envelope. I treat that as a larger-model validation, not as a clean 3B-to-8B scaling comparison.
The Azure host was also checked for a discrete GPU. No NVIDIA device files or matching PCI GPU devices were present, so the results discussed here are CPU-only.
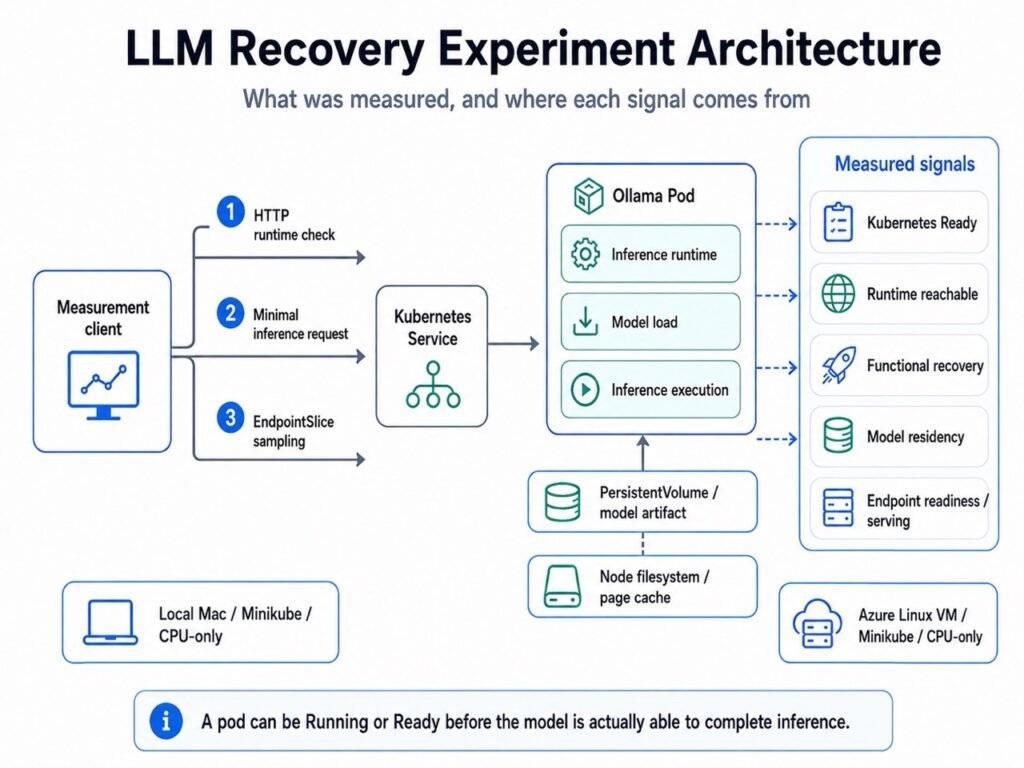
Figure 2: LLM Recovery Experiment Architecture
Baseline Recovery Results
I ran 10 controlled pod-replacement runs for each 1B and 3B configuration.
Mean results:
| Metric | Local 1B | Local 3B | Azure 1B | Azure 3B |
|---|---|---|---|---|
| Kubernetes Ready | 1.66 s | 1.96 s | 1.61 s | 1.69 s |
| Runtime reachable | 2.43 s | 2.44 s | 2.19 s | 2.17 s |
| Functional recovery | 11.11 s | 16.27 s | 5.43 s | 7.73 s |
| Ready -> inference | 9.45 s | 14.31 s | 3.83 s | 6.05 s |
| Model load | 5.51 s | 8.60 s | 2.16 s | 3.96 s |
The Kubernetes part of the recovery stayed fairly small across all four configurations.
The inference part did not.
Across these tests, functional recovery was roughly 3.4x to 8.3x the Kubernetes readiness time.
The Azure environment completed the inference-dependent part of recovery much faster than the local setup. I do not attribute that difference to a single component because CPU, storage, virtualization, host architecture, and cache behavior can all contribute.
The useful observation is simpler: the faster environment reduced the gap, but the gap was still there.
These are measurements from 10 runs per configuration on two environments. They are not intended as universal timing values for Ollama, Kubernetes, or LLM serving in general.
Runtime Available Does Not Mean Model Available
An early version of the experiment used emptyDir for the Ollama model directory.
The replacement pod started normally. Ollama started normally. Kubernetes saw a running workload.
But:
ollama listreturned no model.
The model artifact had disappeared with the old pod.
The next request did not fail because loading was slow. It failed because the model was no longer there.
Moving the model data to a PVC fixed that problem, but the failure was useful because it separated two recovery states:
runtime available
!=
model artifact available
A restarted process does not prove that the data it needs survived the restart.
Model Artifact Does Not Mean Model Residency
The 8B validation made the next state boundary easy to see.
Before inference:
ollama listshowed the model artifact.
But:
ollama psshowed no resident model.
Cgroup memory usage was only around 14 MiB.
After the first inference request, the model appeared resident and cgroup memory increased to roughly 5.27 GiB.
So these are two different claims:
The model exists on disk.and:
The model is loaded and ready to execute inference.A storage check can prove the first. It cannot prove the second.
Filesystem Cache Changes the Inference Side of Recovery
I also wanted to see how much repeated testing on the same node was benefiting from the host cache.
For the 3B model on Azure, I ran matched warm and cold conditions, 10 runs each.
For the cold condition I stopped the model, synchronized the filesystem, and cleared Linux page cache, dentries, and inode caches:
sync
echo 3 > /proc/sys/vm/drop_caches
This is a node-level Linux filesystem/page-cache treatment. It is not an Ollama-specific “model cache.”
The results were:
| Metric | Warm | Cold |
| Functional recovery | 7.58 s | 8.09 s |
| Ready -> inference | 5.70 s | 6.26 s |
| Model load | 3.95 s | 4.61 s |
| Request wall time | 5.11 s | 5.70 s |
Warm to cold:
- Functional recovery: +6.7%
- Ready-to-inference: +9.8%
- Model load: +16.6%
- Request wall time: +11.6%
The cache-clear operation reduced the measured cached-memory value by roughly 66% on average.
The Kubernetes and runtime parts of recovery stayed comparatively stable. The larger change showed up in model loading and the inference-dependent part of the path.
That is worth keeping in mind when recovery tests repeatedly use the same node. A warm host can make later runs look better than a colder node would.
Concurrent Residency Can Change Memory Behavior
One of the more useful failures happened while I was testing memory limits.
A 3B model load failed with:
signal: killedunder a 4 GiB container limit.
The first interpretation would be that the 3B model simply did not fit.
That was not what happened.
A 1B model from an earlier request was still resident. The 3B model was being loaded while that earlier model was still consuming part of the same memory budget.
When I tested the 3B model alone under the same 4 GiB limit, it completed successfully and the cgroup showed no OOM kill.
The useful conclusion was not “3B needs more than 4 GiB.”
It was:
individual model fit
!=
safe overlapping residency
Model lifetime matters, and a runtime-level health check may not expose that problem.
Inference-Aware Readiness
A normal readiness check often proves that the runtime is reachable.
That is useful, but it is not the same as proving that the model can answer a request.
So I tested a stronger readiness condition based on a minimal inference call.
Conceptually:
readinessProbe:
  exec:
    command:
      - sh
      - -c
      - |
        curl -sf -X POST http://localhost:11434/api/generate \
          -H 'Content-Type: application/json' \
          -d '{"model":"llama3.2:1b","prompt":"ping","stream":false}' \
          | grep -q '"done":true'
  periodSeconds: 2
  failureThreshold: 1
The exact command depends on what tools are present in the serving image. The important part is what the probe proves.
Instead of asking whether the API is reachable, it asks whether the serving path can actually complete inference.
EndpointSlice Observation
For the 3B readiness experiment, I sampled Kubernetes EndpointSlice state at roughly 0.5-second intervals during:
- 10 local rollouts
- 10 Azure rollouts
The experiment tracked ready and serving state while the old and replacement pods overlapped.
| Metric | Local 3B | Azure 3B |
| Mean new-endpoint non-serving duration | 47.6 s | 11.0 s |
| Sampled intervals with zero ready + serving endpoints | 0 | 0 |
| Rollouts observed | 10 | 10 |
Across all 20 rollouts, I did not observe a sampled interval with zero ready-and-serving endpoints.
That is a sampled Kubernetes-state result, not a packet-level availability claim. With polling at roughly half-second intervals, I cannot claim that no shorter traffic gap occurred between samples.
What I can say is that the replacement endpoint did not become eligible until the inference-aware readiness condition succeeded, while an existing serving endpoint remained eligible in the sampled intervals.
A More Useful Recovery Model
The experiments so far suggest this operational sequence:
Pod / container recovery
        |
        v
Runtime reachable
        |
        v
Model artifact available
        |
        v
Model load / residency
        |
        v
Successful inference
A Kubernetes readiness probe can be attached to different points in that path.
The mismatch appears when the probe checks an early state but the team interprets Ready as proof of a later one.
That is why I see readiness as a contract.
For a normal API, the contract might be:
My process is initialized and can accept requests.For an LLM workload, it may need to be closer to:
The runtime is running.
The required model exists.
The model can be loaded.
An inference request can complete.
Current Limits
There are several boundaries around the current results.
CPU-only execution
GPU-backed serving adds other initialization and memory-transfer behavior. That is not measured here.
Same-node recovery
The measurements in this note are same-node pod replacements.
A separate cold-node phase is now in progress. The goal is to move the workload to a different Azure VM while keeping the model artifact pre-staged, so node relocation and cold node-local cache can be measured without mixing in model download time.
That work is intentionally being kept separate from the current baseline.
One serving runtime
The current experiments use Ollama. The exact timing values should not be generalized to other runtimes.
Ten repetitions per condition
Ten runs were enough to show a repeatable pattern in these controlled environments. They are not production SLAs.
What I Would Check in Production
If I were reviewing a Kubernetes-hosted LLM workload, I would start with these questions:
- What does the readiness probe actually prove?
- Where does the model artifact live?
- Can the model be present but nonresident?
- Can multiple models overlap in memory?
- Are recovery tests repeatedly benefiting from the same warm node?
- Does Service eligibility reflect runtime availability or actual inference capability?
None of these requires a new Kubernetes feature.
They require being more precise about what “recovered” means.
Current Conclusion
The current experiments show a repeatable difference between Kubernetes readiness and successful inference recovery.
Across the tested 1B and 3B configurations, the mean Ready-to-inference gap ranged from about 3.8 seconds to 14.3 seconds.
Model persistence, model residency, and Linux filesystem cache state all affected the recovery path without necessarily being reflected by a runtime-level readiness signal.
The useful lesson is not that Kubernetes readiness is wrong.
Readiness only means what the workload asks it to mean.
For a self-hosted LLM, a probe that checks process or API reachability may describe a much earlier recovery state than the one an operator actually cares about.
Ongoing Work
The next experiment is cold-node recovery.
The target setup uses two Azure VMs in the same Kubernetes cluster:
- the source node starts with the model actively serving;
- the target node has the model artifact pre-staged;
- the target model is not resident;
- the target filesystem/page cache is explicitly cleared before the measured transition.
That should let me separate same-node recovery from true node relocation without turning the first request into a model-download benchmark.
The cold-node results will be added to the repository after the experiment is completed and validated.
Repository
Source, raw results, scripts, manifests, environment captures, and ongoing experiment work: