
OpsCart Watcher — operational triage for Kubernetes (6 minutes)In November 2025 I published a Bash script that analyzed Kubernetes clusters in about 60 seconds. It generated HTML reports, surfaced crash loops, orphaned resources, and other operational issues that were easy to overlook. The most interesting part wasn’t the script — it was what happened after people started running it. Many told me they found problems they hadn’t known existed.
Looking back, the bash script wasn’t really solving debugging. It was solving prioritization. I just didn’t have the vocabulary for it yet.
That script eventually became four different experiments, then a collection of small scanners, and eventually the dashboard shown in this article.
Over the next eight months, that script evolved into OpsCart Watcher — an open-source operational triage dashboard for Kubernetes. This article is about what the journey taught me, and what I think is still missing from most Kubernetes environments.
The Problem the Script Revealed
The script did one thing well: it looked at an entire cluster and listed what was broken. Engineers who ran it kept telling me the same thing — “I had no idea this was there.”
That response was the important signal. These engineers had Grafana, Prometheus, and kubectl. Visibility was not their problem. The problem was that nothing told them to look at this specific namespace, this specific pod, this specific storage volume — before it became an incident.
Consider a pod in CrashLoopBackOff for 19 days with 5,000+ restarts. To a metrics dashboard, that deployment looks healthy: replica count satisfied, a pod exists in Running state between crashes, CPU and memory flat because the container barely lives long enough to consume anything. The dashboard is answering the question it was built to answer — is the cluster meeting its SLOs? — and the answer is yes.
The question nobody built tooling for: what deserves attention right now?
| Layer | What It Answers | Tools |
|---|---|---|
| Metrics | Is the cluster meeting its SLOs? | Prometheus, Grafana, Datadog |
| Per-resource state | What is this specific pod doing? | kubectl, k9s, Lens |
| Operational triage | What deserves attention right now? | Prioritizing operational work across cluster state |
What Triage Looks Like in Practice
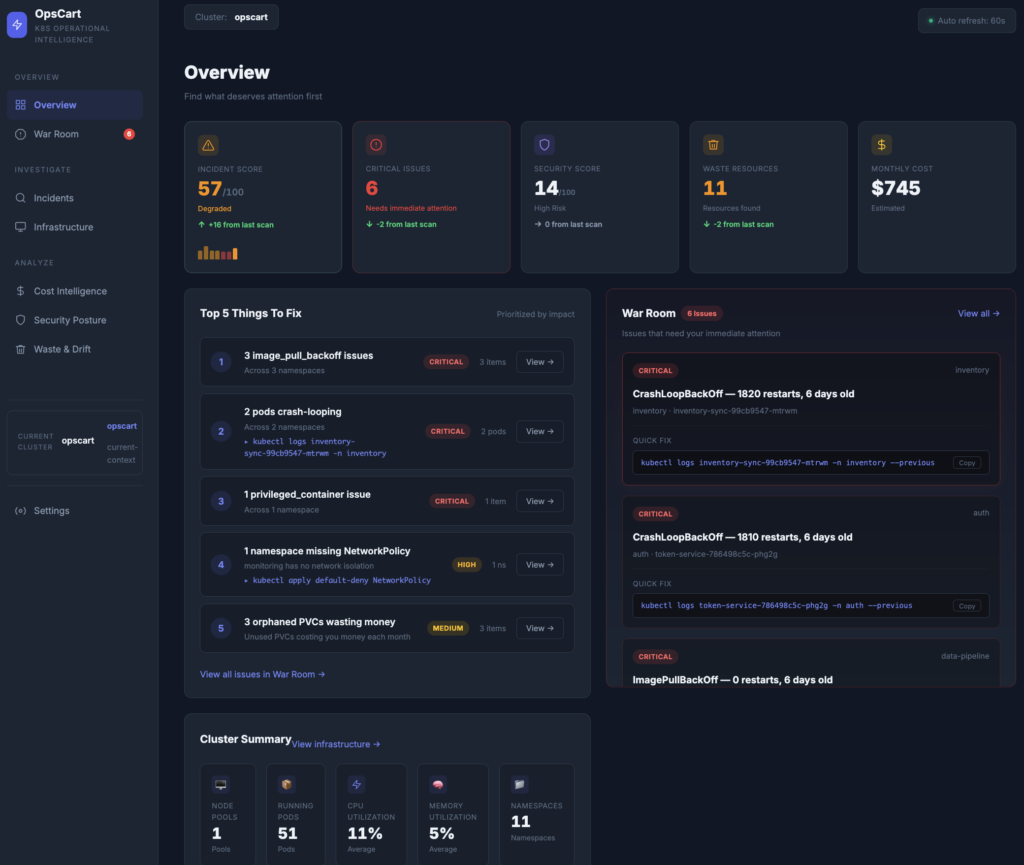
Overview page — Incident Score 41/100, KPI bar, Top 5, War Room panel
The first time I ran the rebuilt dashboard against a cluster with real failures, the top of the screen didn’t show me a CrashLoopBackOff pod. It showed me four CrashLoopBackOff pods spread across three namespaces, collapsed into a single operational problem:
1. 4 pods crash-looping                    CRITICAL
   payments/fraud-detection (1810 restarts)
   → kubectl logs fraud-detection-... -n payments --previous
That collapsing is the entire idea. Instead of inspecting every deployment individually, I was looking at a ranked list of operational problems — each with a severity, a location, and the exact kubectl command to start investigating.
The full output for this environment:
Incident Score:    41/100  (Degraded)

Top 5 Things to Fix:
1. 4 pods crash-looping                    CRITICAL   4 pods
2. 3 image_pull_backoff issues             CRITICAL   3 items
3. 1 privileged_container issue            CRITICAL   1 item
4. 1 namespace missing NetworkPolicy       HIGH       1 ns
5. 3 orphaned PVCs wasting money           MEDIUM     80 GB
None of these had triggered an alert. All were present and accumulating before the scan.
The Incident Score — a composite 0–100 across reliability, security, and waste — exists for one reason. Engineers fix incidents. Managers remember numbers. “We moved the Incident Score from 41 to 67” is a sentence that sticks. The crash loops and NetworkPolicies are the work behind it.
The Step After Detection
Finding problems was never the hard part. Knowing where to begin was.
The most common feedback on the original bash script was some version of: “I found the problem, but I still didn’t know what to do next.”
In March I wrote about finding a container with 24,069 restarts that had been accumulating undetected. Finding it took sixty seconds. The next hour was the actual work: what do I run first? Is this configuration or code? Is it customer-facing?
The investigation page is my answer to that hour.
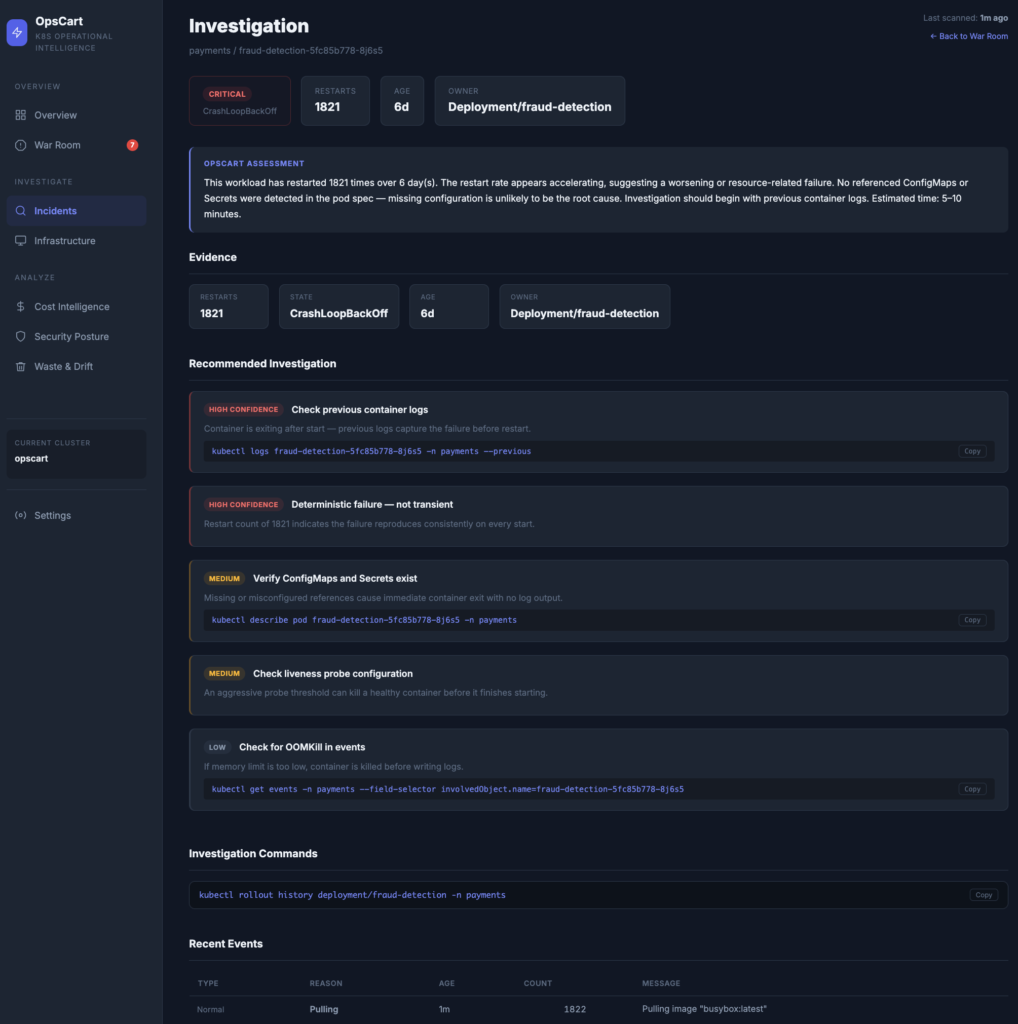
Investigation page — OpsCart Assessment, Evidence, Recommended Investigation
One click from any triage finding opens a dedicated investigation view:
OpsCart Assessment
This workload has restarted 1810 times over 6 days. The restart rate
appears stable, suggesting a deterministic configuration or application
failure rather than an intermittent infrastructure issue. No referenced
ConfigMaps or Secrets were detected in the pod spec — missing
configuration is unlikely to be the root cause. Investigation should
begin with previous container logs. Estimated time: 5–10 minutes.

Evidence
[1810 Restarts]  [CrashLoopBackOff]  [6d]  [Deployment/fraud-detection]

Recommended Investigation
HIGH CONFIDENCE  Check previous container logs
MEDIUM           Verify ConfigMaps and Secrets exist
LOW              Check for OOMKill in events
The assessment is rules-based — no AI. It reads restart count, failure pattern (stable vs accelerating), and referenced configuration objects, then produces a deterministic, auditable summary. The confidence levels reflect how a senior engineer actually reasons: previous logs are almost always the right first move for a crash loop; OOMKill is worth checking but less likely.
This is the part kubectl doesn’t give you. Neither does Lens, k9s, or Headlamp.
From “What Is Broken?” to “What Changed?”
The biggest architectural change came when the dashboard gained memory.
The first version of the tool answered “what is broken?” The current version — backed by a small embedded database recording every scan — answers “what changed?”
That sounds like a minor distinction. Operationally, it changes everything. An incident that has existed for three days deserves different attention than one that appeared five minutes ago. A cluster whose Incident Score dropped eight points overnight is telling you something that no single scan can.
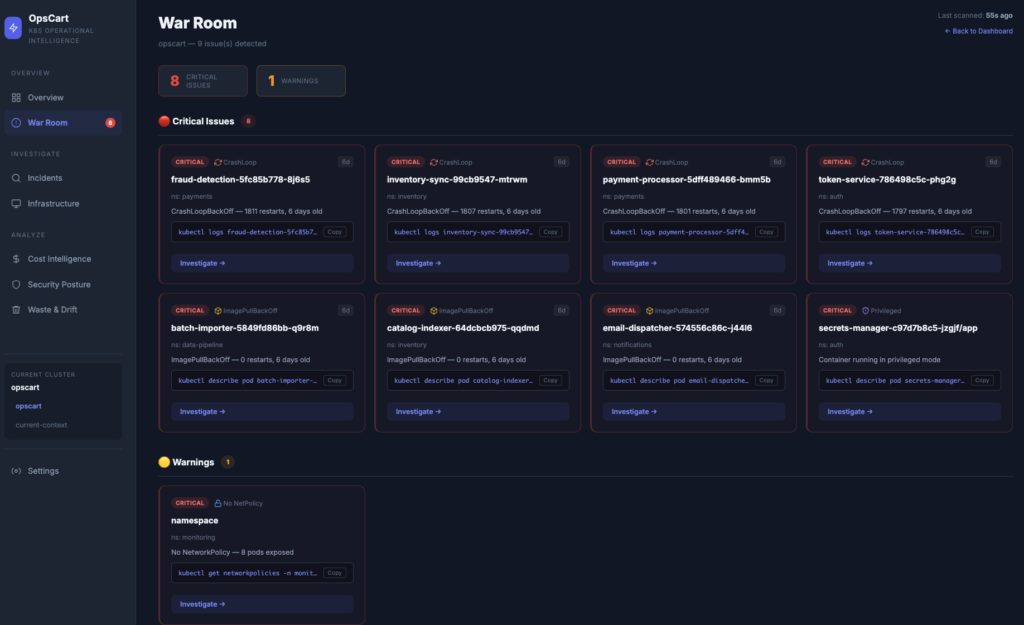
War Room — critical issues with visual differentiation per type
Every KPI now carries a trend arrow — critical issues up three since the last scan, waste down one — and the Incident Score shows a seven-point sparkline. Each incident is tracked with first-seen and last-seen timestamps and an active/resolved status, so “CrashLoopBackOff — first detected 3 days ago, still active” replaces “CrashLoopBackOff.”
Operational memory changed the tool from a scanner into something that remembers the history of a cluster.
What This Is Not
The triage pattern does not answer when an issue started at the metrics level, why an application is slow, or whether last Tuesday’s deployment caused a regression. Prometheus, APM tooling, and deployment audit logs remain the right tools for those questions.
The triage layer is not a replacement for observability. It is the layer that tells you which questions to ask of your observability stack.
The Biggest Lesson
When I started, I thought Kubernetes debugging was about collecting more information.
It wasn’t. Kubernetes already exposes almost everything an operator needs through its API. The difficult part is deciding what deserves attention first.
Over eight months I found myself spending less time searching for failures and more time ranking them. That is ultimately what OpsCart became — not another dashboard, but a prioritization engine for cluster operations.
Why Open Source
I considered keeping the dashboard private. Instead I open-sourced it because operational patterns only become useful when they’re tested across different clusters. Every environment fails differently, and I wanted the prioritization model to evolve from real-world feedback rather than a single infrastructure.
The Remaining Gap
The conclusion from my March article is still true: the question worth asking of your environment is not whether these conditions exist — they almost certainly do — but whether your current observability layer would surface them before they become incident preconditions.
Eight months of building has only made that conclusion more specific. The gap is not data. The gap is attention: knowing which five things, out of hundreds of resources, deserve a human’s time right now.
Eight months ago I thought I was building a better debugging script. I wasn’t. I was building something that helps operators decide where to spend the next ten minutes.
About the environment: The scenarios shown in this article — CrashLoopBackOff pods, orphaned PVCs, missing NetworkPolicies, privileged containers — are representative of what OpsCart finds on real production clusters. The environment shown is a dedicated demonstration cluster configured with realistic failure scenarios. No production data was used.
About the tool: OpsCart Watcher is open-source at github.com/opscart/opscart-k8s-watcher. It deploys as a single read-only container:
#Helm (recommended)
helm install opscart-watcher ./helm/opscart-watcher \
  --namespace opscart-system \
  --create-namespace
kubectl port-forward -n opscart-system svc/opscart-watcher 8080:80

#kubectl:
kubectl apply -f https://raw.githubusercontent.com/opscart/opscart-k8s-watcher/main/deploy/dashboard.yaml
kubectl port-forward -n opscart-system svc/opscart-watcher 8080:80

#Local binary:
git clone https://github.com/opscart/opscart-k8s-watcher.git
cd opscart-k8s-watcher
go build -o opscart-dashboard ./cmd/opscart-dashboard
./opscart-dashboard --cluster my-cluster --port 8080
What This Is Not
Terminal Workflows:
The same scanner runs from the terminal for engineers who prefer CLI workflows or want to pipe output into scripts and reports:
./opscart-scan emergency --cluster prod     # War Room from terminal
./opscart-scan security --cluster prod      # CIS scoring
./opscart-scan waste --cluster prod         # Waste detection
./opscart-scan report --cluster prod        # HTML report
Output formats: HTML, JSON, and Markdown. Useful for scheduled scans, CI pipelines, or sharing findings without the dashboard.
How It Works
OpsCart reads cluster state directly from the Kubernetes API — the same data source as kubectl. It runs as a single statically compiled binary (CGO_ENABLED=0, FROM scratch) with a read-only ClusterRole. No sidecars, no DaemonSets, no node access, no cloud credentials. A lightweight SQLite database (~5MB) stores scan history locally for trend analysis.
The entire stack is auditable: `trivy image ghcr.io/opscart/opscart-dashboard:latest` returns 0 vulnerabilities.
Related Reading
How I Cut Kubernetes Debugging Time by 80% With One Bash Script — the bash script that started this
Kubernetes All Green But System Failing — finding the 24,069-restart container