The Gap Has a Taxonomy
In When Kubernetes Forgets: The 90-Second Evidence Gap, I documented how LastTerminationState is overwritten within 90 seconds of a pod restart — taking OOMKill forensics, resource limits, and ConfigMap references with it. That’s H1.
What I didn’t cover: Kubernetes has four more evidence destruction mechanisms running simultaneously. Each operates on a different schedule. Each destroys a different category of diagnostic context. And none of your existing observability tools address any of them.
After six months of production incident analysis across AKS pharmaceutical clusters and a 30-run controlled experiment on Minikube, I’ve mapped all five. This article covers H2 through H5 — the evidence horizons that fire after the first 90 seconds, and keep firing.
The 90-second gap is the one engineers notice. The other four are invisible until you go looking. Production Kubernetes Debugging Handbook
H2: The Scheduler Has One Hour to Tell You Why
At 2:14 AM, your pod is stuck in Pending. The scheduler fires FailedScheduling events:
0/3 nodes are available: 3 Insufficient memory.
preemption: 0/3 nodes are available: 3 Preemption
is not helpful for scheduling.
Eventually the pod schedules onto the only node with headroom. Forty minutes later, it OOMKills.
You investigate. The OOMKill evidence is there — exit code 137, memory limit 64Mi. But the question that actually matters is: why was this pod placed on that specific node? Was it the only viable node? Were two other nodes rejected because they were already memory-pressured?
That answer existed — briefly — as Kubernetes Event objects. By the time you’re investigating, it’s gone.
The H2 evidence horizon: kube-apiserver prunes Events at a default TTL of 1 hour, or at 1,000 events cluster-wide — whichever comes first.
In active clusters, 1,000 events can accumulate in minutes. Scheduler placement decisions — which nodes were rejected, which predicates failed, which node was ultimately chosen — vanish with them.
# What you see after H2 fires:
$ kubectl get events -n oma-scheduler \
  --field-selector reason=FailedScheduling
No resources found in oma-scheduler namespace.

# What you needed:
# "0/3 nodes available: 3 Insufficient memory"
# Scheduled → opscart-m02 (the only viable node)
# That node subsequently OOMKilled the pod
The causal link between “scheduler placed this pod on the only node with marginal headroom” and “pod OOMKilled on that node” is severed at the H2 boundary.
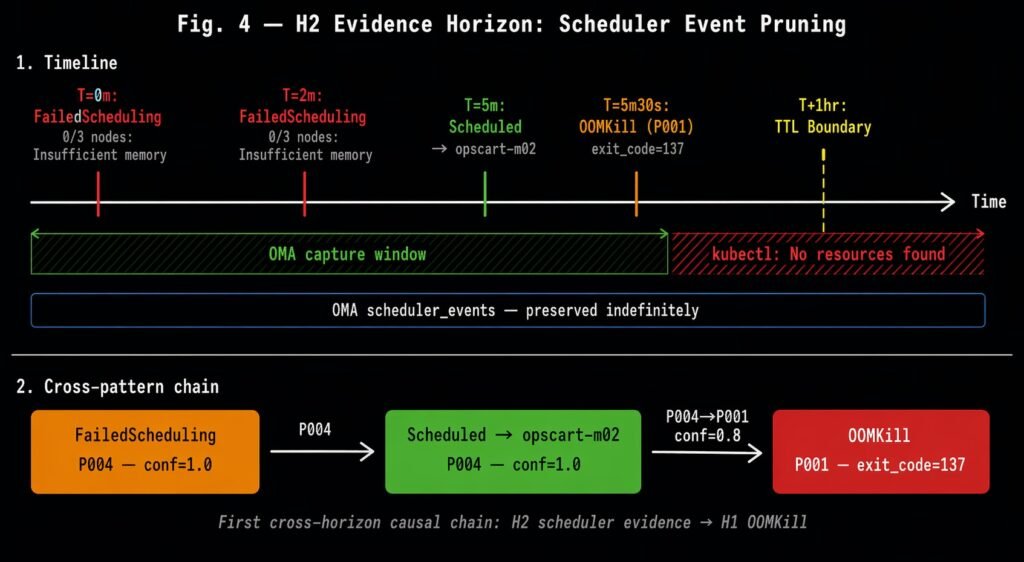
The H2 evidence horizon: FailedScheduling and Scheduled events captured before the kube-apiserver TTL boundary. After TTL expiry, kubectl returns no resources. The cross-pattern chain P004→P001 (conf=0.8) links the scheduler’s placement decision to the downstream OOMKill.
I validated this in a controlled scenario: deployed an unschedulable pod (999Gi request) to generate FailedScheduling events, then a schedulable victim with a 64Mi limit. The victim OOMKilled. Minikube was started with --extra-config=apiserver.event-ttl=2m to make the pruning demonstrable. After 2 minutes:
$ kubectl get events -n oma-scheduler
No resources found in oma-scheduler namespace.
The scheduler’s reasoning — which an experienced SRE would have used to diagnose a capacity planning failure — was gone. An event-driven collector running during the scenario captured both the FailedScheduling predicate message and the Scheduled placement decision before TTL fired, and preserved the cross-pattern causal link to the subsequent OOMKill.
H2 takeaway: You have one hour to capture why the scheduler made the placement decision that led to your failure. After that, the reasoning is gone permanently.
H3: kubectl debug Leaves No Forensic Record
Your pod is behaving oddly — not crashing, just slow. You attach an ephemeral debug container:
kubectl debug my-pod -n production \
  --image=busybox:1.36 \
  --target=app \
  --container=debug-session-1
Inside, you inspect the process tree, check open file descriptors, observe the connection pool state. You find the issue — connection pool exhaustion. You exit with a non-zero code to signal your finding:
[debug] connection pool at 98% capacity
[debug] 847 open connections, limit 860
exit 42
Ten seconds later, your colleague asks: “What did you find in that debug session?” You say “exit code 42 — connection pool.” They ask for the duration. You can’t answer. They ask which container you targeted. You check — the information is gone.
$ kubectl logs my-pod -c debug-session-1 -n production
Error from server (NotFound): container not found

$ kubectl describe pod my-pod -n production | grep -A5 "Ephemeral"
Ephemeral Containers:
  debug-session-1:
    State: Terminated
    # No exit code. No lastState. No duration.
The H3 evidence horizon: EphemeralContainerStatus has no lastState field by Kubernetes API specification.
This is not a bug. It’s a deliberate design choice in Kubernetes v1.32: ephemeral containers are defined as “not restarted on failure” and are explicitly excluded from the last-state tracking mechanism that regular containers have. The moment your debug session exits, the platform discards everything about it.
What’s lost:
- Exit code (your coded finding)
- Session duration
- Which container you targeted (
--target=app) - Node placement context
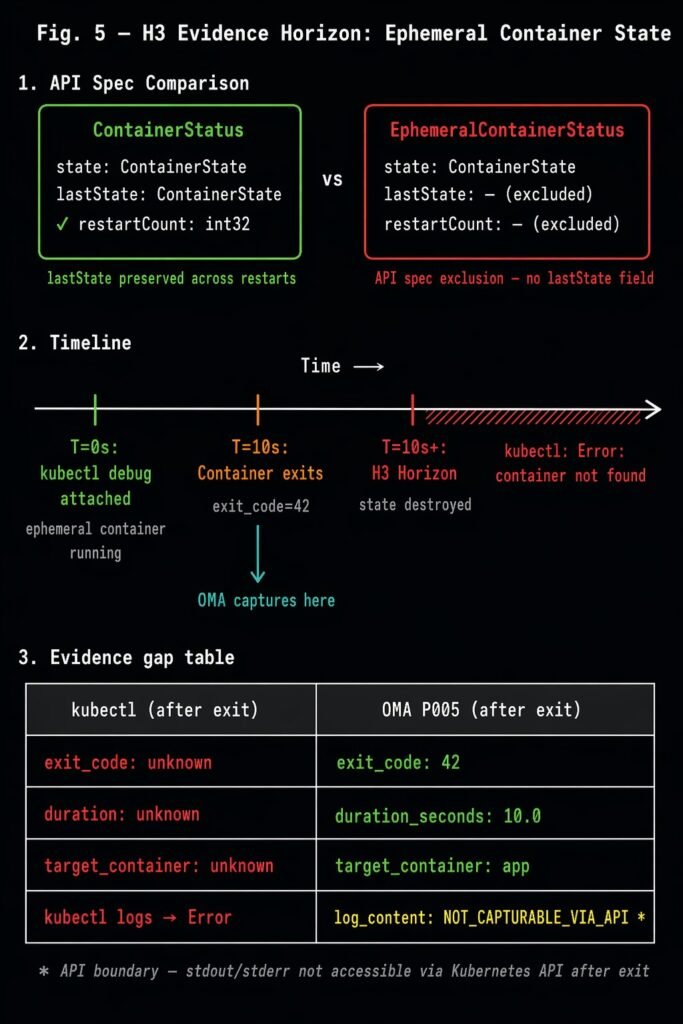
The H3 evidence horizon: EphemeralContainerStatus excludes the lastState field present in ContainerStatus. After container exit, kubectl returns no termination record. OMA P005 captures exit code, duration, and target container at the Terminated transition.
I validated this with a controlled scenario: attached a debug container to a stable target pod, ran for 10 seconds, exited with code 42. After exit:
| What kubectl returns | What was captured |
|---|---|
| Exit code: unknown | exit_code: 42 |
| Duration: unknown | duration_seconds: 10.0 |
| Target container: unknown | target_container: app |
| kubectl logs → Error | log_content: NOT_CAPTURABLE_VIA_API* |
*One genuine API boundary: stdout/stderr content is not capturable after exit — only via kubectl logs while the session is running. Everything else is recoverable if captured at the Terminated transition.
H3 takeaway: Every kubectl debug session your team runs leaves no forensic record. Exit code, duration, target container — gone the moment the session ends.
H4: The Kubelet Restart Gap (The One We Can’t Solve Yet)
Node upgrade at 3:00 AM. The kubelet process restarts. During the 15–60 second reconciliation window between NodeNotReady and NodeReady, pods enter Unknown phase.
When the kubelet comes back, it re-discovers running pods by querying the container runtime. But everything it was doing at the moment of restart — pending volume mount operations, image pulls in progress, liveness probe timer state, eviction decisions in flight — is gone. None of it was persisted to the Kubernetes API. None of it is queryable.
# During the gap:
$ kubectl get pod my-pod -n production
NAME     READY   STATUS    RESTARTS   AGE
my-pod   0/1     Unknown   0          45m

# After recovery:
$ kubectl get pod my-pod -n production
NAME     READY   STATUS    RESTARTS   AGE
my-pod   1/1     Running   0          46m

# What was the kubelet doing when it restarted?
# Was a volume mount in progress?
# Was an image pull 80% complete?
# Was an eviction decision being evaluated?
# → No API call can answer these questions.
H4 is the evidence horizon I’ve identified but cannot yet solve. Full causal capture would require a kubelet-level plugin that persists in-memory operational state to durable storage before process exit — something outside the reach of the Kubernetes watch API that the rest of this work uses.
I’m documenting it here because naming it is the first step to solving it. If you’re building Kubernetes tooling and this resonates, the architectural path is a kubelet plugin or co-located sidecar that journals pending operations continuously.
H4 takeaway: Kubelet restart state loss is real, it’s structural, and it’s currently unsolvable without a kubelet-level integration. We’ve mapped the problem; the solution is future work.
H5: The Pod That Prometheus Never Saw
2:47 AM. A pod OOMKills in 6 seconds. Your Prometheus scrape interval is 15 seconds. The pod’s entire lifetime — startup, allocation, OOMKill, termination — falls between two consecutive scrapes.
# The next morning:
$ promql: container_cpu_usage_seconds_total{pod="ghost-pod"}
# Result: {} (empty)

$ promql: kube_pod_container_status_last_terminated_reason{pod="ghost-pod"}
# Result: {} (empty)

$ kubectl get pod ghost-pod -n production
Error from server (NotFound): pods "ghost-pod" not found
The pod OOMKilled 47 times overnight. Prometheus has zero data points for it. The crash loop went completely undetected.
The H5 evidence horizon: poll-based observability has an irreducible sampling gap.
This is architectural, not a configuration issue. Reducing the scrape interval to 5 seconds doesn’t eliminate the blind spot — it shifts the threshold. Any pod whose lifetime falls within one scrape interval is structurally invisible to Prometheus, regardless of how that interval is configured.
I validated this in a controlled scenario: deployed a pod with a 64Mi limit configured to allocate 128Mi. It OOMKilled at T+5s — a 6-second lifetime. Prometheus scrape interval: 15 seconds (default).
Pod lifetime:      6s
Scrape interval:  15s
Prometheus data:   0 data points

OMA (event-driven via Kubernetes watch API):
  OOMKill P001 captured at T+5s
  exit_code=137  memory_limit=64Mi  node=opscart-m03
The structural difference: Prometheus asks the world questions every N seconds. An event-driven collector subscribes to the Kubernetes watch API and receives every state transition at the moment it occurs — regardless of when it falls within any scrape window.
H5 takeaway: Any pod that lives and dies faster than your Prometheus scrape interval is invisible to your entire metrics stack. This is not configurable away.
The Full Picture
Here’s where all five horizons sit together:
| Horizon | What fires | When | What’s lost |
|---|---|---|---|
| H1 | Pod restart | ~90 seconds | OOMKill forensics, limits, ConfigMaps |
| H2 | Event TTL | 1hr / 1000 events | Scheduler placement rationale |
| H3 | Debug session exit | Immediate | Exit code, duration, target context |
| H4 | Kubelet restart | Node restart | Pending ops, probe state |
| H5 | Scrape interval | Per interval | Sub-interval pod lifetimes |
H1, H2, and H3 destroy Kubernetes API state that existed. H4 and H5 prevent diagnostic data from reaching any persistent store in the first place. Different mechanisms, same result: the evidence your team needs to explain a failure is gone before investigation begins.
The Implementation
The patterns described in this article are implemented as an open-source research system: the Operational Memory Architecture (OMA) at github.com/opscart/k8s-causal-memory.
It captures:
- P001–P003 (H1): OOMKill chain, ConfigMap env var staleness, volume mount propagation
- P004 (H2): Scheduler decision provenance —
FailedSchedulingpredicate failures before TTL - P005 (H3): Ephemeral container exit state at the
Terminatedtransition
All scenarios are reproducible on Minikube. The full technical paper with 30-run statistical analysis and AKS validation is available as a preprint: Zenodo DOI: 10.5281/zenodo.19685352.
Conclusion
The 90-second gap gets all the attention because it’s the one engineers bump into during incidents. The other four fire quietly, destroying evidence you didn’t know you needed until you need it.
H2 fires while you’re still writing the incident ticket. H3 fires the moment your debug session closes. H4 fires during the node upgrade you scheduled at 3 AM. H5 fires for every pod that crashes faster than Prometheus can blink.
None of these are tooling failures. They’re architectural properties of how Kubernetes was designed — optimized for self-healing, not for explaining decisions.
Understanding the full taxonomy is the first step to building systems that survive it.
Resources:
- When Kubernetes Forgets: The 90-Second Evidence Gap — H1 deep dive
- github.com/opscart/k8s-causal-memory — Open-source implementation
- Full research paper — 30-run statistical analysis, AKS validation