It’s 3 AM.
Your production cluster is “healthy.” Dashboards are green. Alerts are quiet.
And yet customers are complaining about intermittent failures.
You SSH into nodes. You inspect pod logs. You scan recent events. Everything looks fine — but something is clearly wrong.
If this sounds familiar, it’s because Kubernetes clusters are excellent liars. They hide critical operational, security, and cost issues behind layers of abstraction and deceptively “healthy” status indicators.
After spending countless hours in war rooms chasing ghost problems, we discovered an uncomfortable truth:
Clusters routinely report “healthy” while carrying risks that can bring them down tomorrow.
This article shows what those risks look like in real clusters — and how to surface them in under 60 seconds.
What Your Monitoring Stack Isn’t Telling You
Most Kubernetes monitoring focuses on:
- CPU, memory, disk usage
- Pod status and restarts
- Application latency and error rates
What it doesn’t surface well:
- Containers running as root in production
- Privileged workloads with host access
- Namespaces idle for weeks, burning money
- Pods crash-looping thousands of times without triggering critical alerts
- Security misconfigurations that don’t fail fast — but fail catastrophically
Your cluster can show 99.9% uptime while quietly accumulating operational debt and security risk.
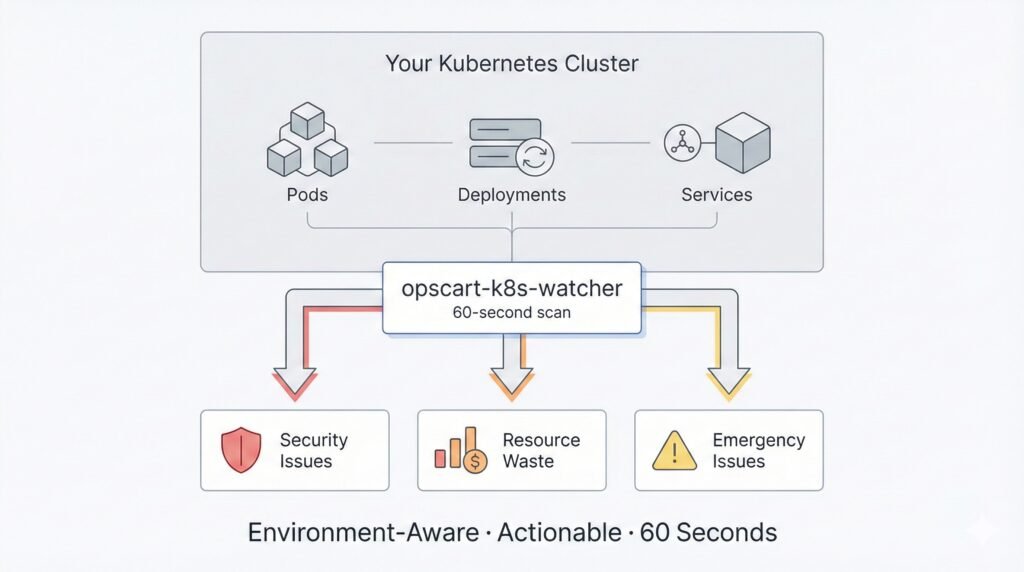
Architecture Overview Figure 1: How opscart-k8s-watcher surfaces hidden risks in 60 seconds
The War-Room Reality Check (60 Seconds)
To expose these blind spots, we built opscart-k8s-watcher — a Kubernetes scanner designed for incidents, not compliance reports.
In under 60 seconds, it answers the questions engineers ask during outages, not during quarterly audits.
1. Security Blind Spots (CIS Pod Security Subset)
While you’re debugging application issues, your cluster may already be unsafe:
🔴 CRITICAL FINDINGS:
• Containers running as root: 31
  └─ PRODUCTION: 10 (⚠️ REQUIRES IMMEDIATE ACTION)
• Privileged containers: 3
  └─ SYSTEM: 3 (expected for infrastructure)
• HostPath volumes: 31
Instead of dumping hundreds of CIS checks, the scanner focuses on high-impact pod-level risks:
- Privileged containers
- Root execution
- Host namespace access
- Missing resource limits
Findings are:
- Environment-aware (PROD vs DEV vs SYSTEM)
- Prioritized by real risk
- Mapped to exact Kubernetes resources
Because a privileged container in kube-system is normal — the same container in production is a critical incident waiting to happen.
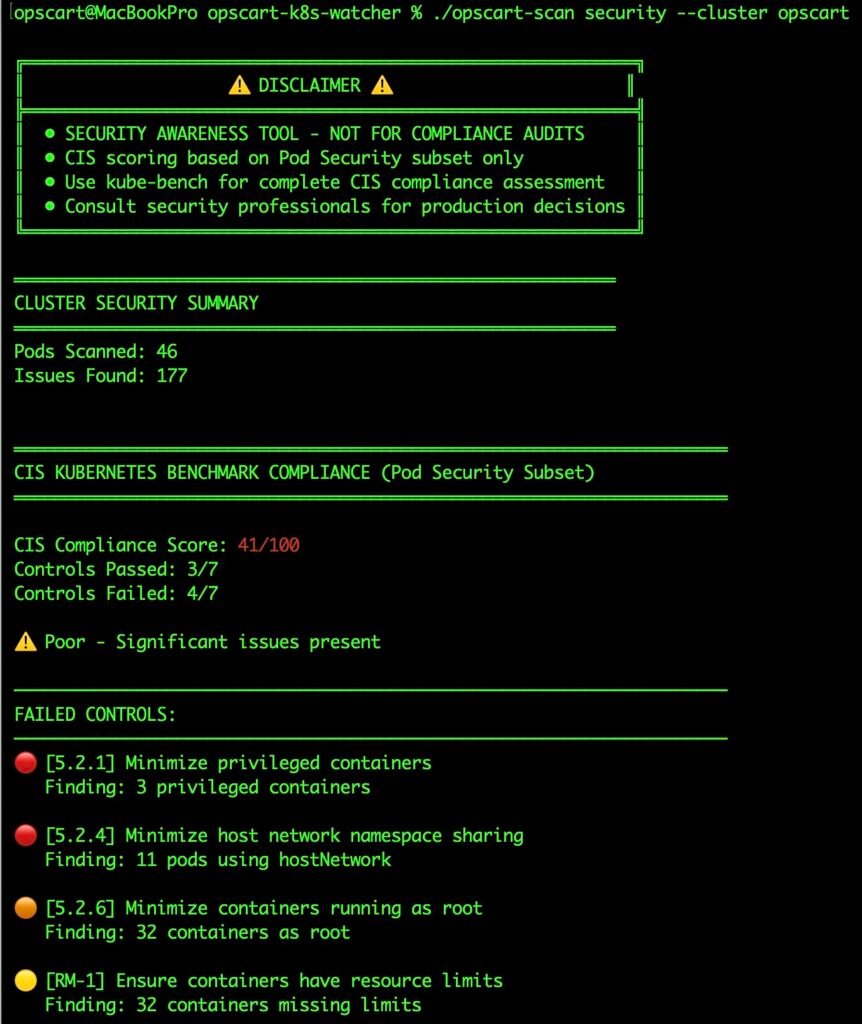
Security Scan Output Figure 2: Real security scan output showing environment-aware analysis
2. Resource Waste Hiding in Plain Sight
Clusters don’t just fail suddenly — they quietly waste money first:
OPTIMIZATION OPPORTUNITIES:
🔴 HIGH IMPACT:
• staging idle for 21+ days (0.3 CPU, 0.4 GB)
  └─ kubectl delete namespace staging
• development idle for 14+ days (0.2 CPU, 0.2 GB)
These aren’t “optimization suggestions.” They are immediate, reversible actions with clear impact.
Idle namespaces, over-allocated workloads, and production-grade resources running dev workloads add up — often unnoticed for months.
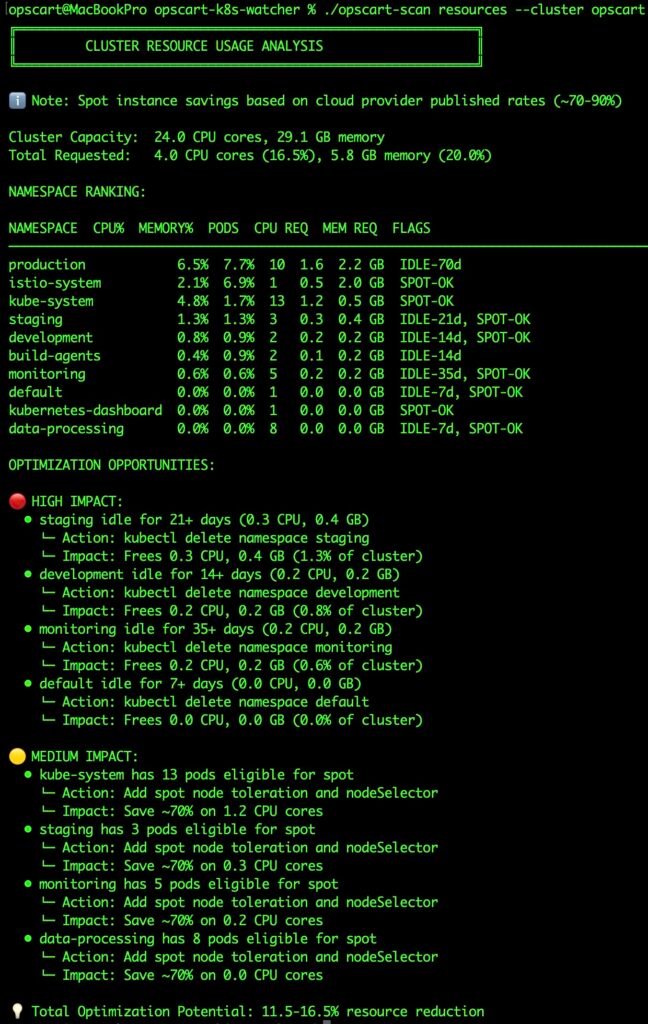
Resource Analysis Output Figure 3: Resource waste detection with actionable kubectl commands
3. Emergency Issues That Don’t Trigger Alerts
Some of the most dangerous failures don’t cross alert thresholds:
🔴 CRITICAL ISSUES:
kubernetes-dashboard
└─ Status: CrashLoopBackOff
└─ Restarts: 2157
A pod that has restarted 2,157 times is not “healthy.” Yet many clusters tolerate this indefinitely.
These issues:
- Degrade cluster stability
- Mask deeper configuration problems
- Eventually cascade into larger outages
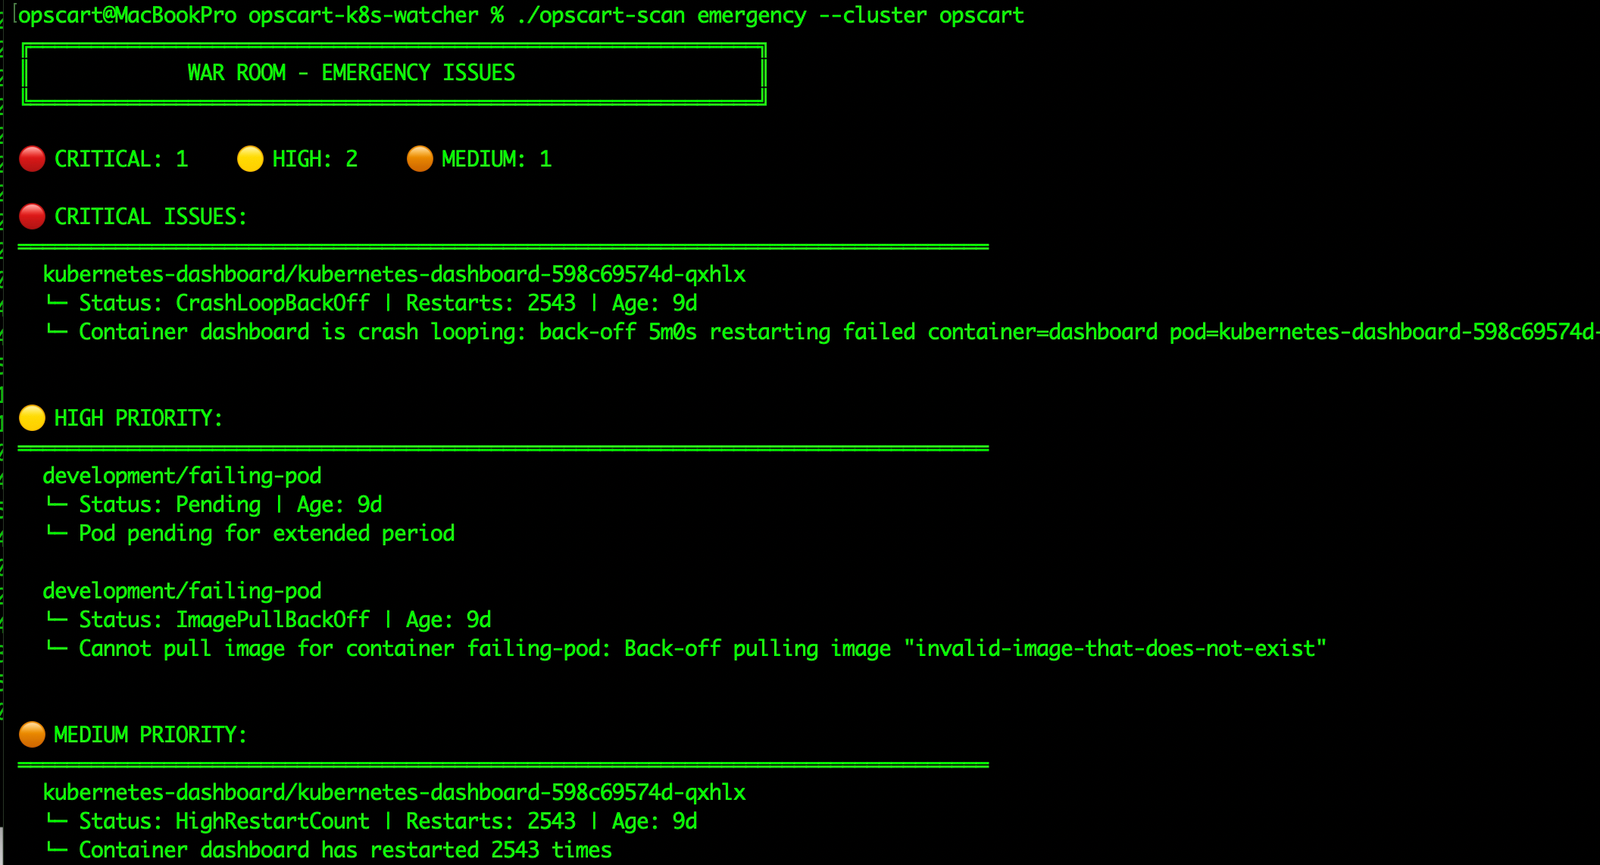
Emergency Scan Output Figure 4: Emergency scanner detecting crash loops and failures
Why Traditional Tools Miss This
Monitoring systems are excellent at answering:
- Is it down right now?
- Is CPU spiking?
- Is latency increasing?
They’re bad at answering:
- Is this safe?
- Is this wasteful?
- Is this quietly rotting?
- What will fail next?
Structural risk rarely looks like an outage — until it suddenly becomes one.
A War-Room-First Design
opscart-k8s-watcher doesn’t try to replace Prometheus, Grafana, or kube-bench.
It does something different:
Environment-Aware Intelligence
Every finding is categorized:
- PRODUCTION → fix immediately
- STAGING → fix before promotion
- DEVELOPMENT → acceptable, but track
- SYSTEM → expected for infrastructure
Actionable, Not Noisy
Instead of dashboards full of charts, you get:
- Top affected resources
- Clear risk explanation
- Suggested remediation paths
- Commands you can run now
This is information you can act on during an incident, not after a postmortem. Production Kubernetes Debugging Handbook
What Teams Discover on Their First Scan
The “Healthy” Cluster Reality
- Dozens of root containers in production
- Privileged workloads with host access
- Crash-looping pods running for weeks
- Idle namespaces wasting thousands per year
The “Optimized” Cluster Reality
- 30–40% hidden resource waste
- Spot-eligible workloads on expensive nodes
- Dev environments consuming prod-grade capacity
The “Secure” Cluster Reality
- Failing most pod-level CIS controls
- Missing resource limits across critical services
- Over-permissive service accounts everywhere
Built for Incidents — Not Audits
This tool is not:
- A compliance certification solution
- A replacement for kube-bench
- A full cost-management platform
It is a war-room scanner.
It answers the questions engineers ask when:
- “Everything is green, but users are complaining”
- “Why does this cluster feel unstable?”
- “What are we ignoring that will hurt us later?”
The 60-Second Challenge
Run this against your cluster — right now:
./opscart-scan security --cluster your-prod-cluster
./opscart-scan emergency --cluster your-prod-cluster
./opscart-scan resources --cluster your-prod-cluster
You will find something surprising. You will probably find several things uncomfortable.
Your cluster is lying to you.
The only question is how long you’ll keep believing it.
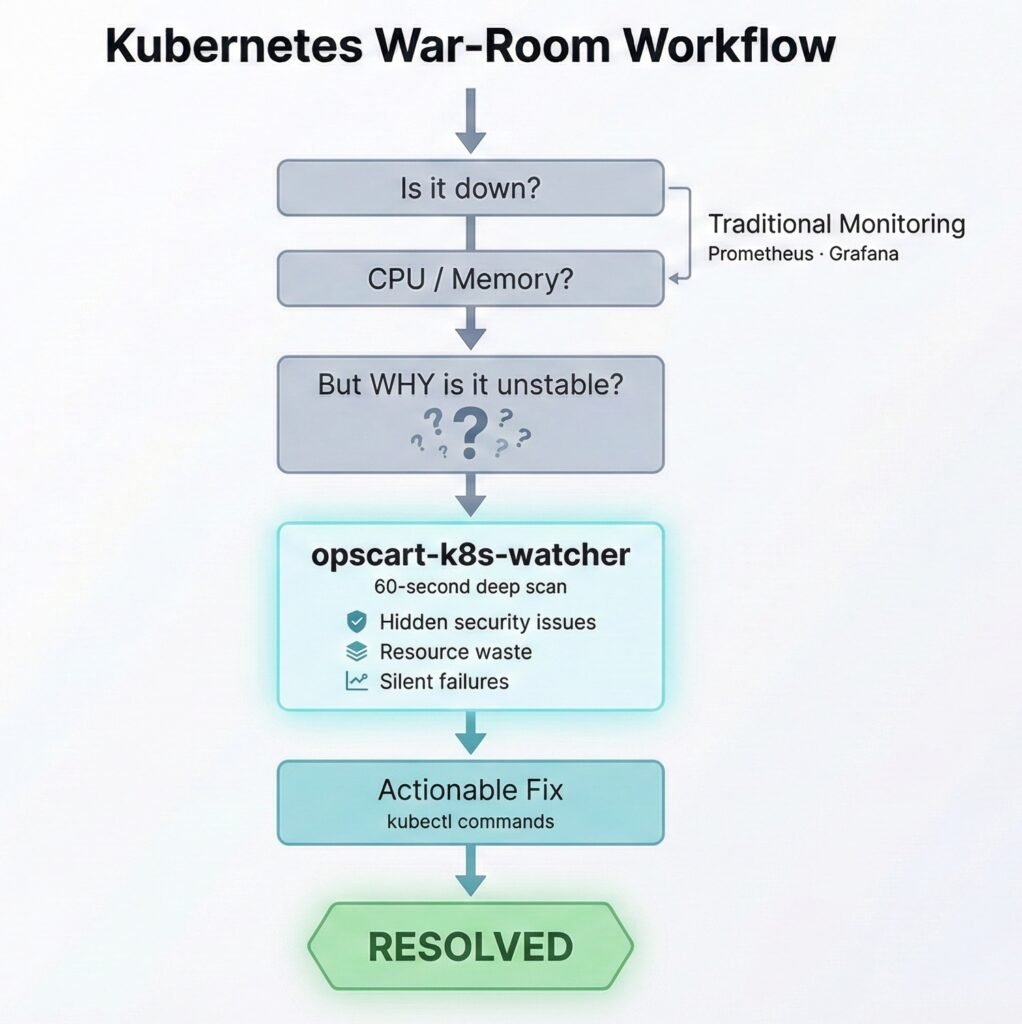
War Room Workflow Figure 5: opscart-k8s-watcher in your incident response workflow
Try It Now
Installation
# Clone the repository
git clone https://github.com/opscart/opscart-k8s-watcher.git
cd opscart-k8s-watcher

# Build the scanner
go build -o opscart-scan cmd/opscart-scan/main.go

# Run your first scan
./opscart-scan security --cluster your-cluster
Available Commands
# Security audit with CIS scoring
./opscart-scan security --cluster prod-aks-01

# Emergency scanner (war room)
./opscart-scan emergency --cluster prod-aks-01

# Resource analysis and optimization
./opscart-scan resources --cluster prod-aks-01

# Cost analysis
./opscart-scan costs --cluster prod-aks-01 --monthly-cost 5000

# Find resources across clusters
./opscart-scan find pod --cluster prod-aks-01 --name=backend

# Cluster snapshot
./opscart-scan snapshot --cluster prod-aks-01
What You’ll Get
CIS Kubernetes Benchmark–aligned checks (Pod Security subset)
Environment-aware analysis (PRODUCTION vs DEVELOPMENT)
Top 5 specific resources per issue type
Actionable remediation steps with kubectl commands
Features
- Security Auditing – CIS Kubernetes Benchmark v1.8 (Pod Security subset)
- Emergency Scanner – Crash loops, pending pods, image pull failures
- Resource Analysis – Cluster utilization, idle detection, spot eligibility
- Cost Optimization – Idle resources, right-sizing opportunities
- Multi-Cluster Search – Find resources by type with filters
- Enhanced Snapshots – Complete cluster state capture
Important Disclaimer
This is a security awareness and troubleshooting tool – NOT for:
- Compliance auditing (use kube-bench)
- Financial decision-making
- Production security decisions without professional review
What it IS for:
- Quick security posture checks
- War room troubleshooting
- Resource optimization opportunities
- Trend tracking across environments
Resources
- GitHub Repository: opscart/opscart-k8s-watcher
- Documentation: README.md
- CIS Kubernetes Benchmark: v1.8 Documentation
- kube-bench: Official CIS compliance tool
Connect:
- Blog: OpsCart.com
- LinkedIn: linkedin.com/in/shamsher-khan
- GitHub: github.com/opscart
- Email: opscart.inc@gmail.com
Remember: This tool provides awareness, not decisions. Always validate findings with security professionals and cloud architects before making production changes.