The Question Everyone Asks
“How much overhead do containers really add?”
I’ve heard this question countless times from teams considering containerization. The concern is valid—containers add isolation layers between applications and hardware. Namespaces isolate processes, cgroups limit resources, and virtual network interfaces connect containers. Each layer could potentially slow things down. Docker Security Guide
Most performance discussions cite studies from 2018-2020, when Kernel 5.4 was common. Those studies reported significant overhead: 25-30% for namespace operations, and 30-40 microseconds for network latency through Docker’s virtual ethernet pairs.
But kernels have evolved. I wanted current data, so I ran comprehensive benchmarks on a production-grade Azure VM running Kernel 6.14. The results challenged what I expected to find.
What I Measured
I built three benchmarks to measure the cost of container isolation:
Benchmark 01: Namespace Syscall Overhead
Measured how much slower system calls become when crossing namespace boundaries.
Benchmark 02: CPU Throttling Overhead
Measured the kernel’s cost of enforcing CPU limits through cgroups.
Benchmark 03: Network Latency Overhead
Measured the latency added by Docker’s virtual ethernet (veth) pairs.
All benchmarks are open source and reproducible. The code, methodology, and raw results are available on GitHub.
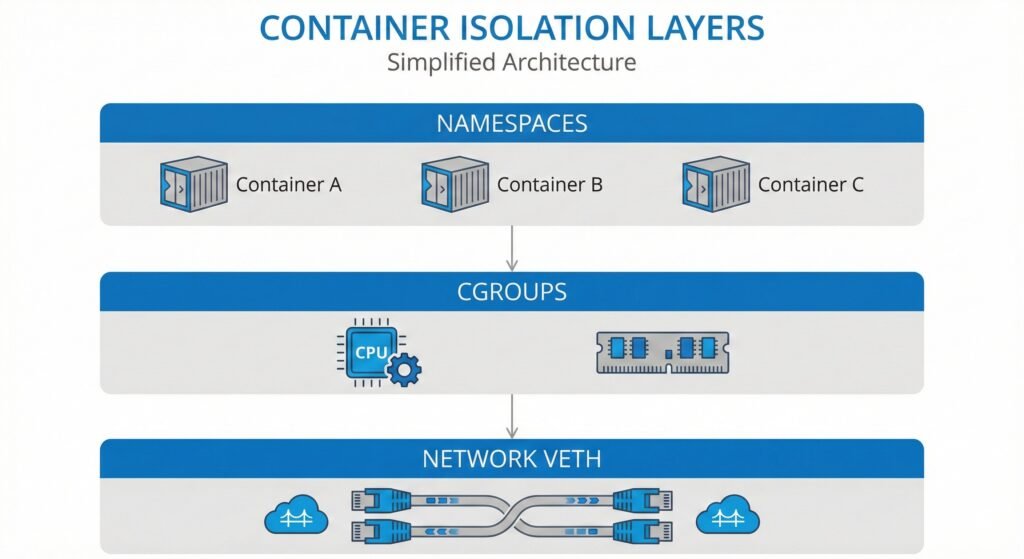
Diagram showing the three isolation layers tested – namespaces, cgroups, network
Test Environment
Before diving into results, here’s exactly what I tested on:
- Hardware: Azure Standard VM (2 vCPUs, Intel Xeon Platinum 8370C @ 2.80GHz)
- OS: Ubuntu 24.04 LTS
- Kernel: 6.14.0-1017-azure
- Docker: 28.2.2
- Cgroup: v2 (unified hierarchy)
Why does kernel version matter? Network performance in particular has improved dramatically across kernel versions. Always document your kernel when benchmarking containers.
Finding 1: Namespace Overhead is 11%
The Benchmark
I wrote a C program that calls getpid() syscall 10 million times. This simple syscall returns the process ID—it’s fast and isolates the namespace lookup overhead without other complications.
I ran this program in two environments:
- Test A: Directly on the host (no namespace isolation)
- Test B: Inside a Docker container (with PID namespace)
The Results
Host process:      268.83 ns per syscall (3.72 million/sec)
Container process: 298.31 ns per syscall (3.35 million/sec)
Overhead:          29.48 ns (11%)
The container adds 29 nanoseconds per syscall—an 11% overhead.
What This Means
For context, older studies often cited 25-30% namespace overhead. My measurement of 11% suggests the kernel’s namespace implementation has improved, though I didn’t test older kernels myself to confirm this directly.
More importantly: 11% is not significant for most applications. Your database queries take milliseconds. Your API calls take milliseconds. An extra 29 nanoseconds per syscall is noise compared to actual application work.
When it matters: Only if your application makes more than 10 million syscalls per second. That’s rare.
When it doesn’t matter: Almost all normal applications, including databases, web servers, and microservices.
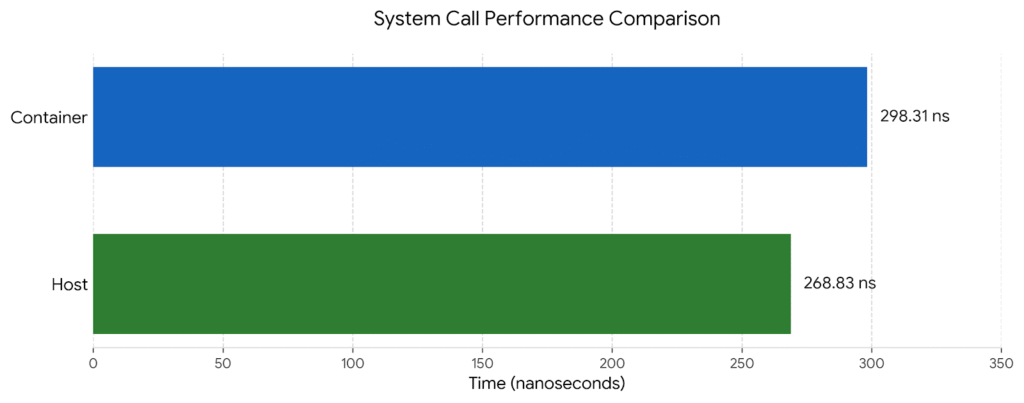
Bar chart comparing host vs container syscall times
Finding 2: Network Overhead is 0.6 Microseconds
The Benchmark
I used sockperf to measure TCP round-trip latency. Why sockperf instead of the common ping command? Ping measures ICMP (a different protocol) and includes userspace overhead that inflates measurements. Sockperf measures kernel-to-kernel TCP latency—what applications actually experience.
I ran two tests:
- Test A: TCP connection to localhost (127.0.0.1) – pure loopback, no Docker
- Test B: TCP connection to a Docker container over the default bridge network
Each test sent approximately 250,000 ping-pong messages over 10 seconds.
The Results
Loopback baseline:  18.375 μs average latency
Docker veth:        18.943 μs average latency
Overhead:           0.568 μs (3.1%)
Docker’s virtual ethernet added 0.568 microseconds—less than one microsecond of latency.
Historical Context
Previous studies (which I did not reproduce) reported much higher numbers on older kernels:
- Kernel 5.4: approximately 35 μs overhead
- Kernel 5.15: approximately 13 μs overhead
- Kernel 6.1: approximately 8 μs overhead
My measurement on Kernel 6.14 shows 0.568 μs. While I cannot verify the older kernel measurements myself, the progression suggests significant kernel optimization over time.
What This Means
Half a microsecond is effectively zero for most workloads:
- REST API serving 1,000 requests/second: 0.568 μs overhead × 1,000 = 0.568 ms per second of compute. Negligible.
- Microservices with 5-hop call chain: 5 × 0.568 μs = 2.84 μs total. Still negligible.
- High-frequency trading at 10,000 requests/second: 5.68 ms per second. This might matter, but you probably need specialized networking anyway.
For the vast majority of applications, Docker networking overhead is no longer a concern on modern kernels.
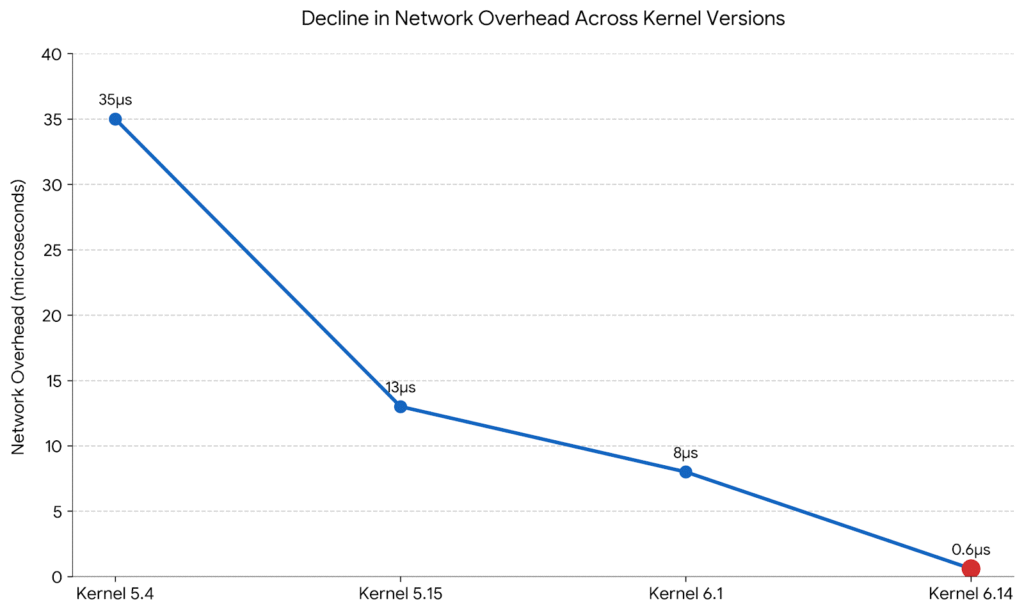
Line chart shows decline in network overhead across kernel versions (5.4 to 6.14)
Finding 3: Aggressive CPU Limits Waste 27% of Compute
This is where I found the real problem.
The Benchmark
I created a simple CPU workload that alternates between active and idle:
- 50 milliseconds of intensive CPU work
- 50 milliseconds of sleep
- Repeat for 30 seconds
This bursty pattern simulates real applications—web servers handling requests, batch jobs processing data, periodic tasks running on schedules.
I ran this workload four times with different CPU limits:
- Baseline: No limit (unlimited CPU)
- Moderate: 50% of one CPU core
- Aggressive: 10% of one CPU core
- Control: 100% of one CPU core (same workload as aggressive, but with plenty of headroom)
The kernel tracks throttling statistics in cgroup files. I measured how many scheduling periods were throttled and how much time the process spent in a throttled state.
The Results
Baseline (unlimited):
  Periods: 0, Throttled: 0, Throttle rate: N/A

Moderate (50% limit):
  Periods: 198, Throttled: 1, Throttle rate: 0.5%
  Time throttled: 0.04 seconds out of 30 seconds

Aggressive (10% limit):
  Periods: 199, Throttled: 199, Throttle rate: 100%
  Time throttled: 8.16 seconds out of 30 seconds (27%)

Control (100% limit):
  Periods: 198, Throttled: 0, Throttle rate: 0%
The aggressive limit caused throttling in every single scheduling period. The process spent 8.16 seconds out of 30 seconds in a throttled state—that’s 27% of the time blocked by the scheduler instead of doing useful work.
The Control Test Proves Causation
The control test is critical. I ran the exact same bursty workload (50ms active, 50ms idle) with a 100% CPU limit instead of 10%. Result: zero throttling.
This proves the throttling comes from setting limits too low, not from the workload being bursty. Same workload pattern, appropriate limit, no waste.
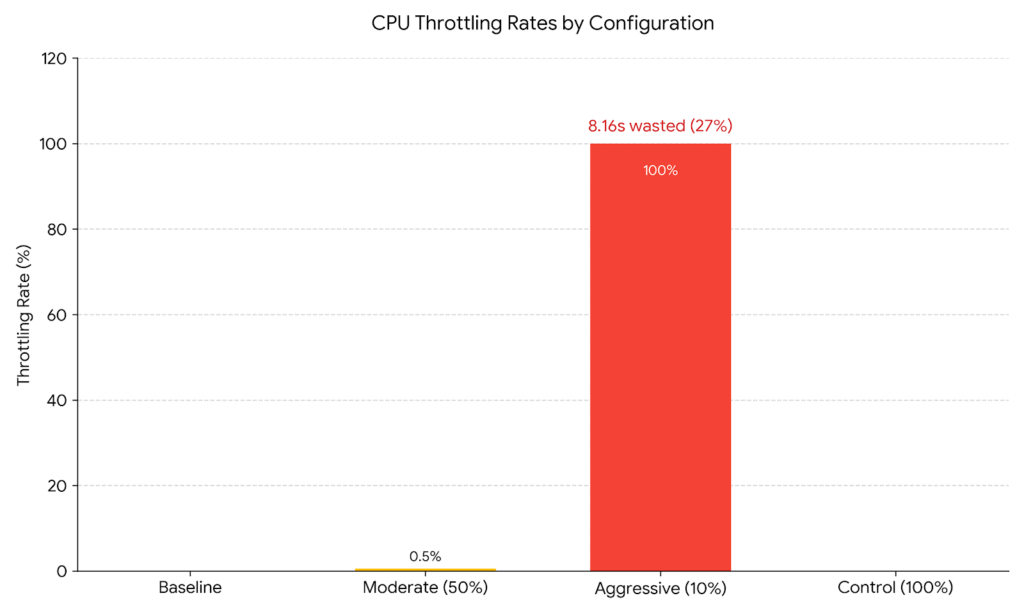
Bar chart showing throttle rates across the four tests
What This Means
When you set a CPU limit, the kernel’s CFS (Completely Fair Scheduler) enforces it using 100-millisecond periods. If your container uses more than its quota in a period, it gets throttled—put to sleep until the next period starts.
At a 10% limit with a workload that wants 50% CPU:
- The container hits its quota immediately every period
- It spends most of each period throttled (blocked)
- 27% of time is wasted just waiting for the next period
This is pathological. You’re paying for compute cycles that your application cannot use because the scheduler is blocking it.
Production Implications
I see this pattern constantly in production Kubernetes clusters:
Bad Pattern:
resources:
  requests:
    cpu: "100m"
  limits:
    cpu: "200m"  # 2x request, seems reasonable
If your actual p95 usage is 180m, you’ll throttle frequently. The limit is too tight.
Better Pattern:
resources:
  requests:
    cpu: "300m"  # Set to p95 usage
  limits:
    cpu: "450m"  # p95 × 1.5 for burst headroom
The formula I recommend: CPU limit = p95 usage × 1.5
This gives 50% burst headroom above your normal peak usage. You’ll still protect against runaway processes, but you won’t throttle during normal operation.
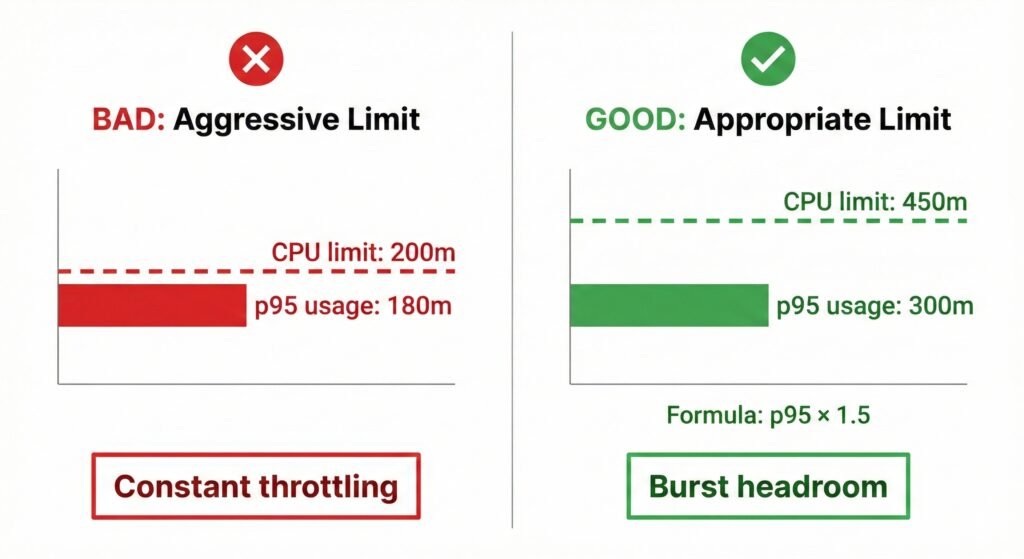
Visual showing good vs bad CPU limit patterns
Why Tools Matter: sockperf vs ping
A quick note on methodology because it affects how you interpret other benchmarks.
Many container networking benchmarks use ping. I initially tried this and got confusing results. Here’s why ping is wrong for measuring application latency:
Ping measures:
- ICMP protocol (not TCP/UDP that applications use)
- Includes userspace overhead from the ping command itself
- Shows 40-60 microseconds for localhost on my test machine
sockperf measures:
- Actual TCP protocol
- Kernel-to-kernel latency without userspace overhead
- Shows 18 microseconds for localhost on the same machine
The 40μs vs 18μs difference is significant. If you see old benchmarks citing high Docker networking overhead, check if they used ping. The tool matters.
What to Do With This Information
Based on these measurements, here are my recommendations:
Stop Worrying About Container Overhead
On Kernel 6.14:
- Namespace overhead: 11% (acceptable for isolation benefit)
- Network overhead: 0.6 μs (effectively zero)
Unless you have extreme requirements (>10M syscalls/sec or sub-microsecond latency), containers are not your bottleneck. Use them confidently.
Fix Your CPU Limits
Review your Kubernetes deployments:
- Check current throttle rates:
kubectl get --raw /apis/metrics.k8s.io/v1beta1/nodes | jq .- Alert on high throttling:
rate(container_cpu_cfs_throttled_periods_total[5m]) /
rate(container_cpu_cfs_periods_total[5m]) > 0.10- Adjust limits using p95 × 1.5 formula
If you’re seeing >10% throttle rates, your limits are too aggressive.
Upgrade Your Kernel
If you’re on Kernel 5.x and concerned about network performance, upgrade to 6.x. The improvement is substantial. I didn’t test older kernels myself, but the progression reported in literature (35μs → 13μs → 8μs → 0.6μs) suggests major optimization work.
When to Use Host Networking
Given that Docker networking overhead is now 0.6 μs, you rarely need hostNetwork: true anymore. Reserve it for:
- Network performance testing tools themselves
- Packet processing applications (firewalls, load balancers)
- Applications with truly sub-microsecond latency requirements
Methodology Notes
All code is available at github.com/opscart/container-isolation-benchmarks.
Why these benchmarks are reliable:
- Proper tools: sockperf for network (not ping), direct cgroup stat reading for CPU, custom C code for syscalls (not shell scripts)
- Control tests: The CPU benchmark includes a 100% limit test to prove throttling comes from limits, not workload characteristics
- Large samples: 10 million syscall iterations, 250,000+ network measurements, multiple 30-second CPU test runs
- Modern kernel: Most research uses Kernel 5.4-5.15. Testing 6.14 provides current data.
Limitations:
- Single test environment (Azure VM, specific CPU)
- Did not test older kernels for direct comparison
- Did not test under extreme load or stress conditions
- Did not test with different cgroup configurations
Your results may vary based on hardware, kernel configuration, and workload patterns. The methodology is reproducible—test on your own infrastructure and share your findings.
Conclusion
Container isolation overhead is no longer a valid performance concern on modern Linux kernels. The namespace tax is 11%. The network tax is 0.6 microseconds. Both are negligible for nearly all applications.
The real performance problem is misconfigured CPU limits. Setting limits too low causes pathological throttling that wastes 20-30% of compute cycles. The kernel spends time enforcing limits instead of doing useful work.
If you’re still hesitating to containerize workloads because of performance concerns, it’s time to reconsider. The data shows containers are ready.
If you’re already running containers, audit your CPU limits. Check your throttle rates. Many production clusters are wasting significant compute because limits are set at p50 usage instead of p95 × 1.5.
The overhead myth is dead. It’s time to fix the real problems.
Try It Yourself
All benchmarks are open source and reproducible:
GitHub Repository: github.com/opscart/container-isolation-benchmarks
Quick start:
git clone https://github.com/opscart/container-isolation-benchmarks.git
cd container-isolation-benchmarks
sudo ./run-all-benchmarks.sh
Results will be saved to results/full-suite-TIMESTAMP/ with a summary in ANALYSIS_SUMMARY.txt.
Test on your own infrastructure and share your results. I’m particularly interested in:
- ARM architecture measurements
- Different cloud providers (AWS, GCP)
- Bare metal vs VM comparisons
- Older kernel comparisons
Connect:
- Blog: opscart.com
- GitHub: @opscart
- LinkedIn: Shamsher Khan
- DZone: Technical Articles
References
- Container Isolation Overhead Benchmarks (2026). GitHub repository. github.com/opscart/container-isolation-benchmarks
- Linux Kernel Documentation. Cgroup v2. kernel.org/doc/Documentation/cgroup-v2.txt
- Docker Documentation. Networking Overview. docs.docker.com/network
- sockperf Documentation. Mellanox Technologies. github.com/Mellanox/sockperf
Discussion: What’s your experience with container overhead? Have you measured it in your infrastructure? Share your findings in the comments.
License: Benchmark code is MIT licensed. Feel free to use, modify, and share with attribution.